Copyright
©2014 Baishideng Publishing Group Co.
World J Gastroenterol. May 7, 2014; 20(17): 5000-5007
Published online May 7, 2014. doi: 10.3748/wjg.v20.i17.5000
Published online May 7, 2014. doi: 10.3748/wjg.v20.i17.5000
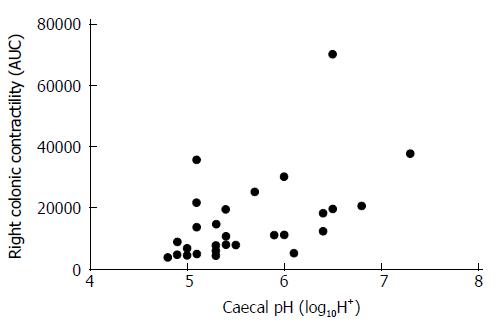
Figure 3 Caecal pH and caecal contractility was positively correlated (r = 0.
54, P = 0.002). AUC: Area under the curve.
- Citation: Farmer AD, Mohammed SD, Dukes GE, Scott SM, Hobson AR. Caecal pH is a biomarker of excessive colonic fermentation. World J Gastroenterol 2014; 20(17): 5000-5007
- URL: https://www.wjgnet.com/1007-9327/full/v20/i17/5000.htm
- DOI: https://dx.doi.org/10.3748/wjg.v20.i17.5000


