Copyright
©2014 Baishideng Publishing Group Co.
World J Gastroenterol. Apr 28, 2014; 20(16): 4662-4674
Published online Apr 28, 2014. doi: 10.3748/wjg.v20.i16.4662
Published online Apr 28, 2014. doi: 10.3748/wjg.v20.i16.4662
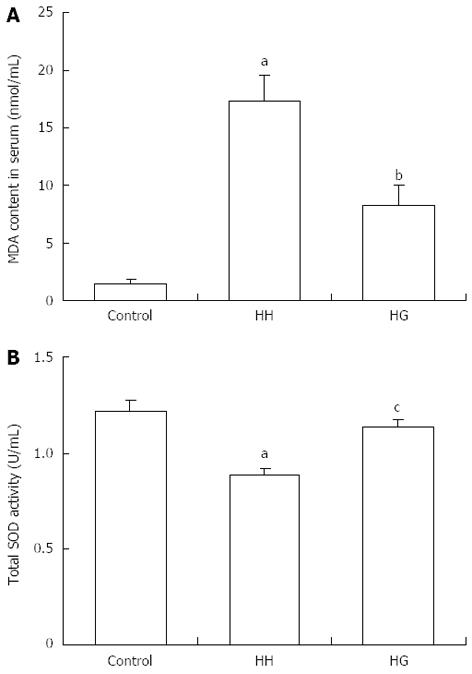
Figure 3 Effects of glutamine treatment on malondialdehyde contents in serum (A) and superoxide dismutase (B).
aP < 0.001 vs Control; bP < 0.05, cP < 0.01 vs HH. Values are expressed as mean ± SEM (n = 7, each). Gln: Glutamine; SOD: superoxide dismutase, MDA: malondialdehyde; Control: Control group; HH: Hypobaric hypoxia group; HG: Hypobaric hypoxia plus Gln treatment group.
- Citation: Xu CL, Sun R, Qiao XJ, Xu CC, Shang XY, Niu WN. Protective effect of glutamine on intestinal injury and bacterial community in rats exposed to hypobaric hypoxia environment. World J Gastroenterol 2014; 20(16): 4662-4674
- URL: https://www.wjgnet.com/1007-9327/full/v20/i16/4662.htm
- DOI: https://dx.doi.org/10.3748/wjg.v20.i16.4662


