Copyright
©2014 Baishideng Publishing Group Co.
World J Gastroenterol. Apr 21, 2014; 20(15): 4345-4352
Published online Apr 21, 2014. doi: 10.3748/wjg.v20.i15.4345
Published online Apr 21, 2014. doi: 10.3748/wjg.v20.i15.4345
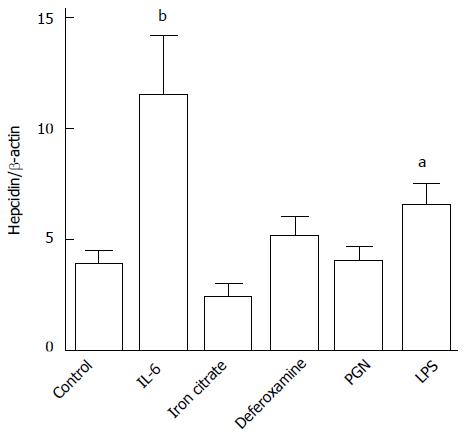
Figure 4 Analysis of hepcidin mRNA expression (hepcidin to β-actin ratio) in HT-29 cells.
Untreated control cells were compared with cells treated with interleukin-6 (IL-6) (40 ng/mL), iron citrate (20 μmol/L), deferoxamine (30 mmol/L), lipopolysaccharide (LPS) (1 μg/mL) or peptidoglycan (PGN) (10 μg/mL). Data are expressed as the means ± SE of 2 experiments performed in triplicate. aP < 0.05 and bP < 0.01 compared with control.
- Citation: Gotardo &MF, Ribeiro GA, Clemente TRL, Moscato CH, Tomé RBG, Rocha T, Pedrazzoli Jr J, Ribeiro ML, Gambero A. Hepcidin expression in colon during trinitrobenzene sulfonic acid-induced colitis in rats. World J Gastroenterol 2014; 20(15): 4345-4352
- URL: https://www.wjgnet.com/1007-9327/full/v20/i15/4345.htm
- DOI: https://dx.doi.org/10.3748/wjg.v20.i15.4345


