Copyright
©2014 Baishideng Publishing Group Co.
World J Gastroenterol. Mar 28, 2014; 20(12): 3287-3300
Published online Mar 28, 2014. doi: 10.3748/wjg.v20.i12.3287
Published online Mar 28, 2014. doi: 10.3748/wjg.v20.i12.3287
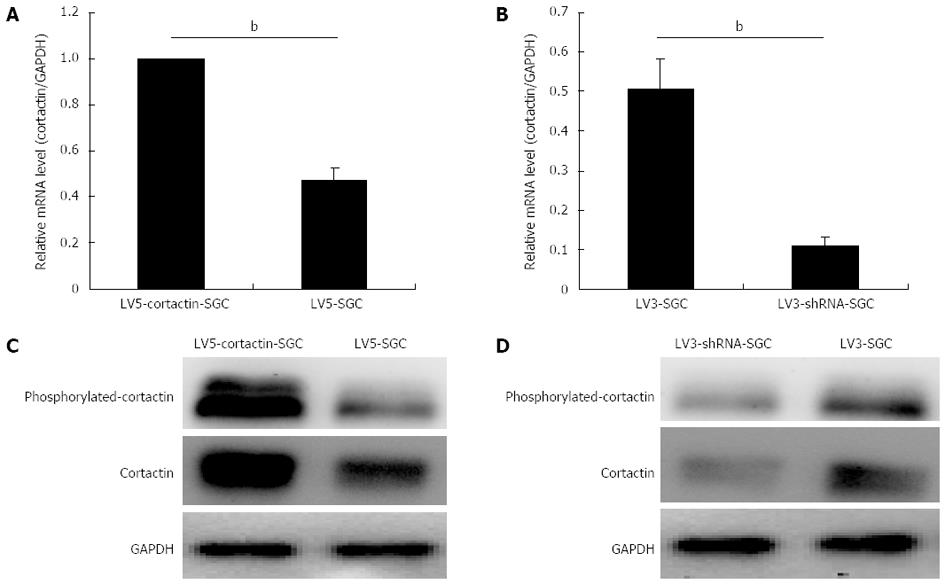
Figure 2 Cortactin expression at the mRNA and protein level in the recombinant cell lines.
A, B: Bar chart represents quantitative real-time polymerase chain reaction assessment of the cortactin mRNA levels in the LV5-cortactin-SGC, LV5-SGC, LV3-SGC and LV3-shRNA-SGC cells (bP < 0.01 between groups, Student’s t-test); C: Western blotting analysis of cortactin and phosphorylated cortactin in the LV5-cortactin-SGC and LV5-SGC control cells. The cortactin and phosphorylated cortactin increased greatly in the LV5-cortactin-SGC cells compared with the LV5-SGC cells; D: Western blotting analysis of cortactin and phosphorylated cortactin in the LV3-shRNA-SGC and LV3-SGC control cells. The levels of cortactin and phosphorylated cortactin were decreased significantly in the LV3-shRNA-SGC cells compared with LV3-SGC cells. Glyceraldehyde-3-phosphate dehydrogenase (GAPDH) was used as an internal control.
- Citation: Wei J, Zhao ZX, Li Y, Zhou ZQ, You TG. Cortactin expression confers a more malignant phenotype to gastric cancer SGC-7901 cells. World J Gastroenterol 2014; 20(12): 3287-3300
- URL: https://www.wjgnet.com/1007-9327/full/v20/i12/3287.htm
- DOI: https://dx.doi.org/10.3748/wjg.v20.i12.3287


