Copyright
©2014 Baishideng Publishing Group Co.
World J Gastroenterol. Mar 28, 2014; 20(12): 3125-3134
Published online Mar 28, 2014. doi: 10.3748/wjg.v20.i12.3125
Published online Mar 28, 2014. doi: 10.3748/wjg.v20.i12.3125
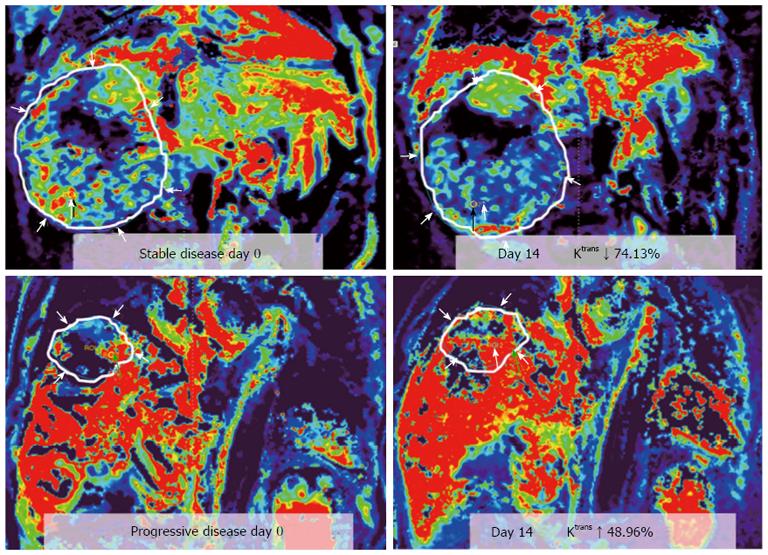
Figure 4 Representative dynamic contrast-enhanced magnetic resonance imaging Ktrans color maps before treatment (day 0, left hand side) and day 14th after treatment (right hand side) in two advanced hepatocellular carcinoma patients.
Corresponding hypervascular area was indicated by red color. region of interests analysis is more sensitive based on hypervascular part than entire tumor, with mean values. Ktrans is a good diagnostic biomarker in differentiation between stable disease (SD, upper row) and progressive disease (PD, lower row) in two patients with hepatocellular carcinoma. Difference of Ktrans (∆Ktrans ) between SD and PD measured on hypervascular part and entire tumor are both significant. (From reference [58], reprint with permission).
- Citation: Chen BB, Shih TTF. DCE-MRI in hepatocellular carcinoma-clinical and therapeutic image biomarker. World J Gastroenterol 2014; 20(12): 3125-3134
- URL: https://www.wjgnet.com/1007-9327/full/v20/i12/3125.htm
- DOI: https://dx.doi.org/10.3748/wjg.v20.i12.3125


