Copyright
©2014 Baishideng Publishing Group Co.
World J Gastroenterol. Mar 28, 2014; 20(12): 3125-3134
Published online Mar 28, 2014. doi: 10.3748/wjg.v20.i12.3125
Published online Mar 28, 2014. doi: 10.3748/wjg.v20.i12.3125
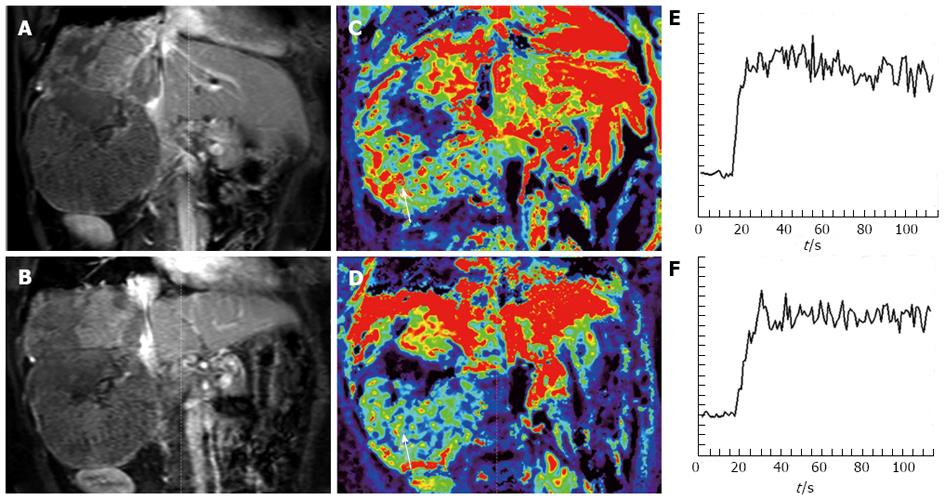
Figure 3 Representative dynamic contrast-enhanced magnetic resonance imaging findings in one advanced hepatocellular carcinoma patient.
A: Post-contrast T1-weighted magnetic resonance imaging at baseline; B: After 14 d of study treatment; C: Corresponding color Ktrans maps at baseline; D: After 14 d of study treatment. Hypervascular area was indicated by red color. The selected region of interest for Ktrans measurement was indicated by white arrows. In this patient, the Ktrans values at baseline and after study treatment were 798.6 × 10⁻³/min and 206.6 × 10⁻³/min, respectively; E: The initial area under the gadolinium concentration-time curves (IAUC) at baseline; F: After study treatment from the same patient. The IAUC values at baseline and after study treatment were 1526.2 mmol/kg × s and 1376.1 mmol/kg × s, respectively. (From reference [58], reprint with permission).
- Citation: Chen BB, Shih TTF. DCE-MRI in hepatocellular carcinoma-clinical and therapeutic image biomarker. World J Gastroenterol 2014; 20(12): 3125-3134
- URL: https://www.wjgnet.com/1007-9327/full/v20/i12/3125.htm
- DOI: https://dx.doi.org/10.3748/wjg.v20.i12.3125


