Copyright
©2014 Baishideng Publishing Group Co.
World J Gastroenterol. Mar 21, 2014; 20(11): 3025-3032
Published online Mar 21, 2014. doi: 10.3748/wjg.v20.i11.3025
Published online Mar 21, 2014. doi: 10.3748/wjg.v20.i11.3025
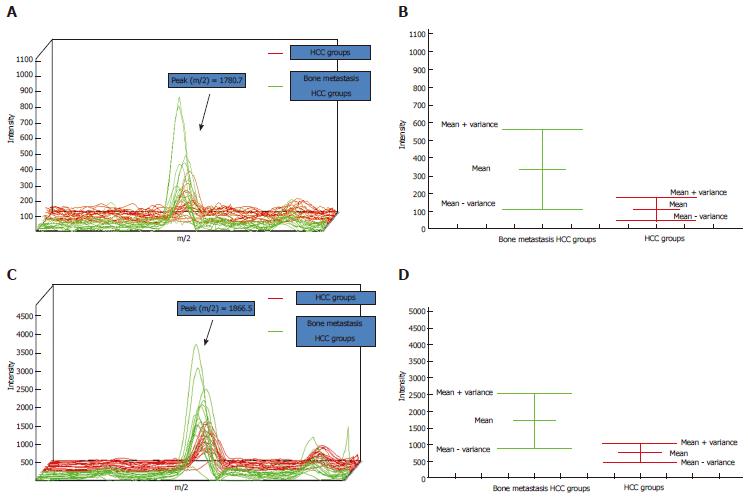
Figure 1 Profiles of peptides with m/z of 1780.
7 and 1866.5. A, C: The profiles of peptides 1780.7 and 1866.5, respectively. X-axis, molecular mass (m/z); y-axis, intensity; the green line represents the bone metastasis hepatocellular carcinoma (HCC) group and the red line represents the HCC group; B, D: The mean variance figures for (A) and (C). X-axis: Groups; y-axis: Intensity.
- Citation: He J, Zeng ZC, Xiang ZL, Yang P. Mass spectrometry-based serum peptide profiling in hepatocellular carcinoma with bone metastasis. World J Gastroenterol 2014; 20(11): 3025-3032
- URL: https://www.wjgnet.com/1007-9327/full/v20/i11/3025.htm
- DOI: https://dx.doi.org/10.3748/wjg.v20.i11.3025


