Copyright
©2014 Baishideng Publishing Group Co.
World J Gastroenterol. Mar 21, 2014; 20(11): 3002-3010
Published online Mar 21, 2014. doi: 10.3748/wjg.v20.i11.3002
Published online Mar 21, 2014. doi: 10.3748/wjg.v20.i11.3002
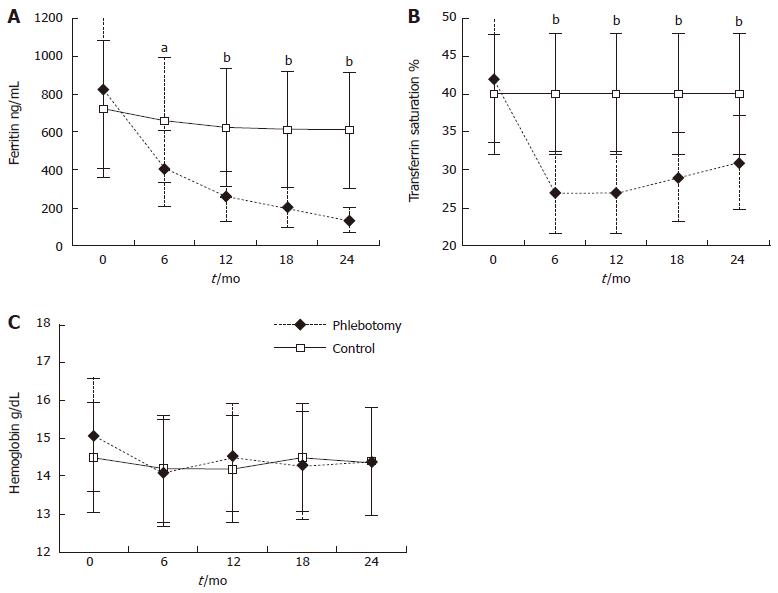
Figure 2 Effect of treatment on iron status and erythropoiesis.
Effect of treatment on the levels of ferritin (A), transferrin saturation (B), and hemoglobin (C). Phlebotomy: dashed lines and black squares; Lifestyle changes alone: continuous lines and empty squares. aP < 0.05, bP < 0.01 between phlebotomy and lifestyle changes alone treatment arms.
- Citation: Valenti L, Fracanzani AL, Dongiovanni P, Rovida S, Rametta R, Fatta E, Pulixi EA, Maggioni M, Fargion S. A randomized trial of iron depletion in patients with nonalcoholic fatty liver disease and hyperferritinemia. World J Gastroenterol 2014; 20(11): 3002-3010
- URL: https://www.wjgnet.com/1007-9327/full/v20/i11/3002.htm
- DOI: https://dx.doi.org/10.3748/wjg.v20.i11.3002


