Copyright
©2014 Baishideng Publishing Group Co.
World J Gastroenterol. Mar 21, 2014; 20(11): 2979-2994
Published online Mar 21, 2014. doi: 10.3748/wjg.v20.i11.2979
Published online Mar 21, 2014. doi: 10.3748/wjg.v20.i11.2979
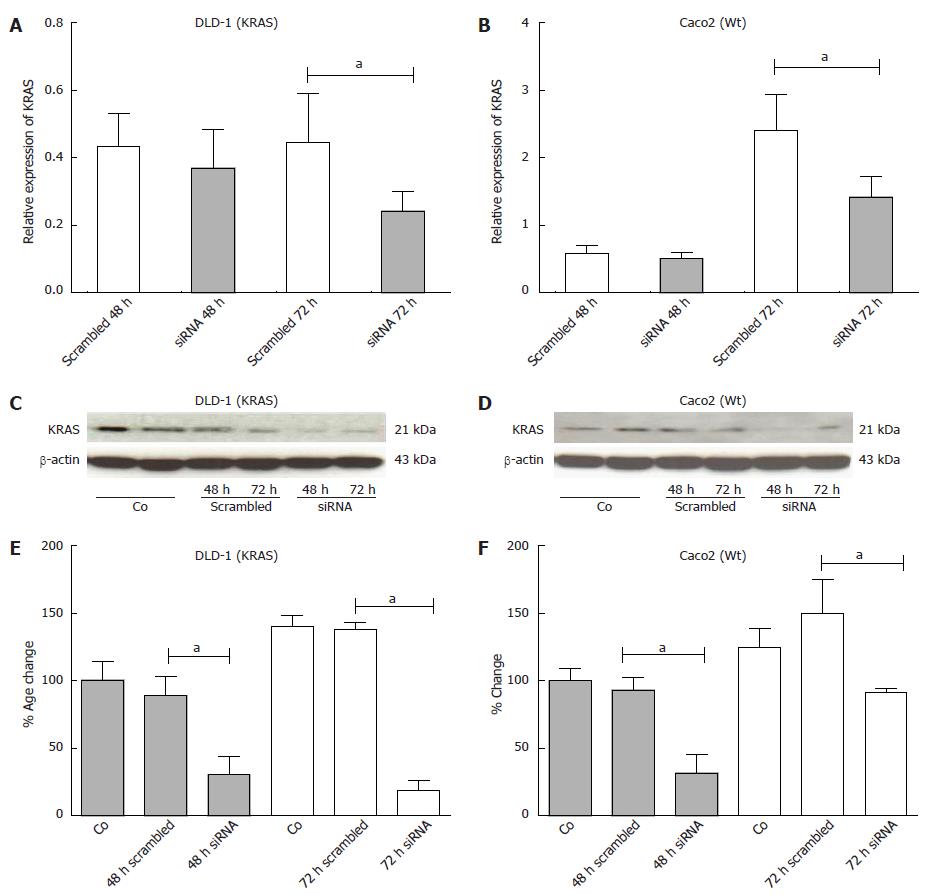
Figure 8 The figure shows the results of KRAS inhibition from transient transfection of KRAS siRNA in DLD-1 and Caco2 cell lines at RNA and protein level.
A-D: Relative expression of KRAS at RNA-level by RT-PCR (A and B) and protein expression by Western blotting (C and D) at 48 h and 72 h after KRAS inhibition; E, F: Note the significant down-regulation of KRAS at 48 and 72 h at protein level by densitometric analysis in both, DLD1 and Caco2 cell-lines. Changes are shown in percent, compared to scrambled siRNA. Data are presented as mean ± SE of 3 independent experiments with double confirmation. aP < 0.05 vs scrambled 72 h.
-
Citation: Khan S, Cameron S, Blaschke M, Moriconi F, Naz N, Amanzada A, Ramadori G, Malik IA. Differential gene expression of chemokines in
KRAS andBRAF mutated colorectal cell lines: Role of cytokines. World J Gastroenterol 2014; 20(11): 2979-2994 - URL: https://www.wjgnet.com/1007-9327/full/v20/i11/2979.htm
- DOI: https://dx.doi.org/10.3748/wjg.v20.i11.2979


