Copyright
©2014 Baishideng Publishing Group Co.
World J Gastroenterol. Mar 21, 2014; 20(11): 2979-2994
Published online Mar 21, 2014. doi: 10.3748/wjg.v20.i11.2979
Published online Mar 21, 2014. doi: 10.3748/wjg.v20.i11.2979
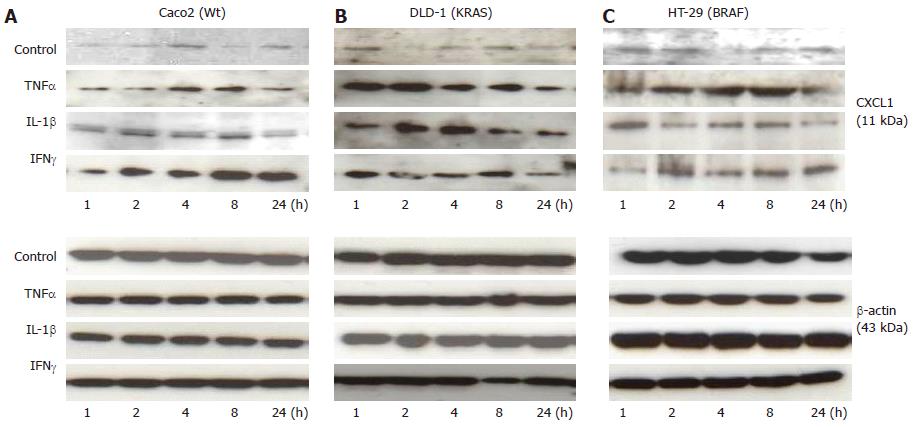
Figure 5 Caco2 (Wt), DLD-1 (KRAS) and HT-29 (BRAF) Western blotting analysis.
The bands represent chemokine (C-X-C motif) ligand (CXCL)-1 protein expression (upper panel) at different time points after stimulation of Caco2 (A), DLD-1 (B) and HT-29 (C) cell lines with tumor necrosis factor-α (TNFα) (50 ng/mL), interleukin (IL)-1beta (1 ng/mL) and interferon (IFN)-gamma (50 ng/mL) compared to the loading control betabb-actin (lower panel).
-
Citation: Khan S, Cameron S, Blaschke M, Moriconi F, Naz N, Amanzada A, Ramadori G, Malik IA. Differential gene expression of chemokines in
KRAS andBRAF mutated colorectal cell lines: Role of cytokines. World J Gastroenterol 2014; 20(11): 2979-2994 - URL: https://www.wjgnet.com/1007-9327/full/v20/i11/2979.htm
- DOI: https://dx.doi.org/10.3748/wjg.v20.i11.2979


