Copyright
©2014 Baishideng Publishing Group Co.
World J Gastroenterol. Mar 14, 2014; 20(10): 2653-2663
Published online Mar 14, 2014. doi: 10.3748/wjg.v20.i10.2653
Published online Mar 14, 2014. doi: 10.3748/wjg.v20.i10.2653
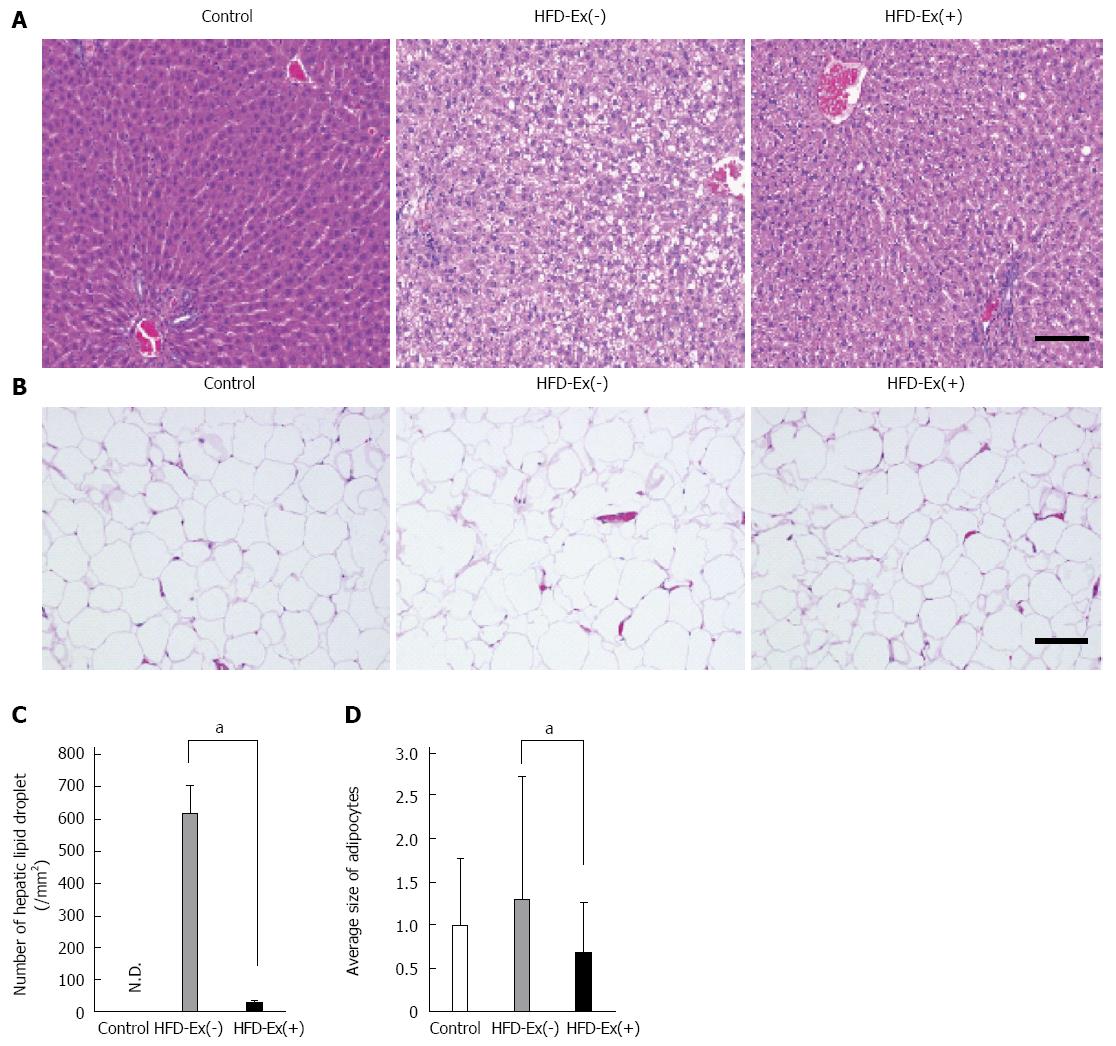
Figure 3 Histological evaluation of lipid accumulation in the liver and adipose tissue.
A: Numerous hepatocytes containing lipid droplets were observed in the high-fat diet (HFD)-Ex(-) group, whereas scant lipid-containing hepatocytes were found in the HFD-Ex(+) group; B: In epididymal white adipose tissue, there were abundant enlarged adipocytes in the HFD-Ex(-) group but not in the HFD-Ex(+) group; C: The number of hepatic lipid droplets was significantly decreased in the HFD-Ex(+) group compared with the HFD-Ex(-) group; D: The mean diameter of adipocytes in the HFD-Ex(+) group was significantly smaller than that in the HFD-Ex(-) group and was similar to that in the control group. The fold changes were calculated as the ratio of the average size of adipocytes in the HFD-Ex(+) or HFD-Ex(-) group to that in the control group. n = 5, aP < 0.05 between groups. Scale bar = 100 μm. ND: Not detected.
- Citation: Tanaka K, Masaki Y, Tanaka M, Miyazaki M, Enjoji M, Nakamuta M, Kato M, Nomura M, Inoguchi T, Kotoh K, Takayanagi R. Exenatide improves hepatic steatosis by enhancing lipid use in adipose tissue in nondiabetic rats. World J Gastroenterol 2014; 20(10): 2653-2663
- URL: https://www.wjgnet.com/1007-9327/full/v20/i10/2653.htm
- DOI: https://dx.doi.org/10.3748/wjg.v20.i10.2653


