Copyright
©2014 Baishideng Publishing Group Co.
World J Gastroenterol. Jan 7, 2014; 20(1): 264-273
Published online Jan 7, 2014. doi: 10.3748/wjg.v20.i1.264
Published online Jan 7, 2014. doi: 10.3748/wjg.v20.i1.264
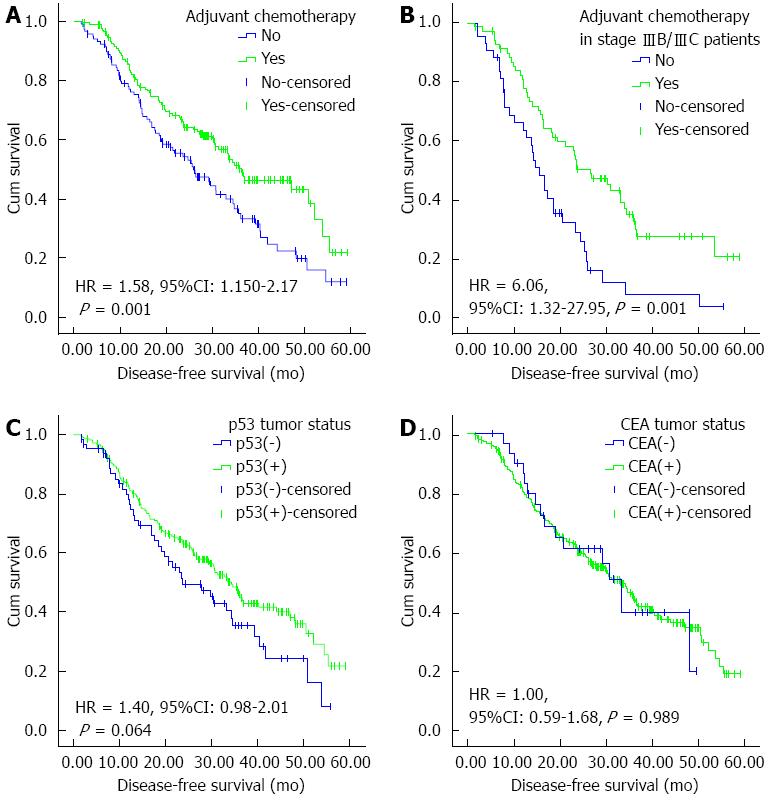
Figure 2 Kaplan-Meier curves for disease-free survival of patients after D2 gastrectomy for stage II/III gastric adenocarcinoma.
A: Adjuvant chemotherapy or not in the entire cohort; B: Adjuvant chemotherapy or not in stage IIIB/IIIC patients; C: p53 tumor status as measured by immunohistochemistry; D: CEA tumor status as measured by immunohistochemistry. HR and 95%CI were calculated with green curves as references. CEA: Carcinoembryonic antigen.
- Citation: He MM, Zhang DS, Wang F, Wang ZQ, Luo HY, Ren C, Jin Y, Chen DL, Xu RH. Adjuvant chemotherapy, p53, carcinoembryonic antigen expression and prognosis after D2 gastrectomy for gastric adenocarcinoma. World J Gastroenterol 2014; 20(1): 264-273
- URL: https://www.wjgnet.com/1007-9327/full/v20/i1/264.htm
- DOI: https://dx.doi.org/10.3748/wjg.v20.i1.264


