Copyright
©The Author(s) 1996.
World J Gastroenterol. Sep 15, 1996; 2(Suppl1): 9-11
Published online Sep 15, 1996. doi: 10.3748/wjg.v2.iSuppl1.9
Published online Sep 15, 1996. doi: 10.3748/wjg.v2.iSuppl1.9
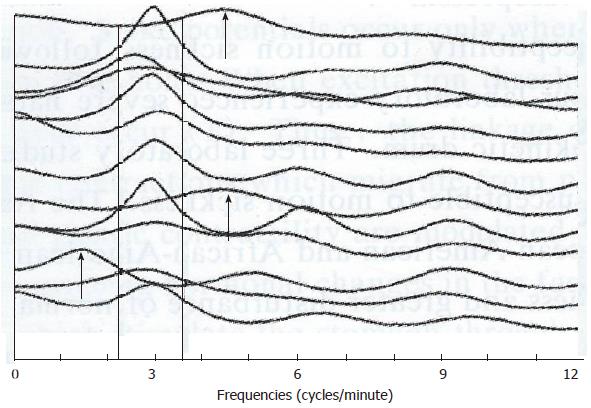
Figure 2 Running power spectra illustrating the computation of the percentage of normal gastric slow waves and the percentage of dysrhythmias.
- Citation: Chen JD. Spectral analysis of electrogastrogram and its clinical significance. World J Gastroenterol 1996; 2(Suppl1): 9-11
- URL: https://www.wjgnet.com/1007-9327/full/v2/iSuppl1/9.htm
- DOI: https://dx.doi.org/10.3748/wjg.v2.iSuppl1.9


