Copyright
©2013 Baishideng Publishing Group Co.
World J Gastroenterol. Mar 7, 2013; 19(9): 1405-1415
Published online Mar 7, 2013. doi: 10.3748/wjg.v19.i9.1405
Published online Mar 7, 2013. doi: 10.3748/wjg.v19.i9.1405
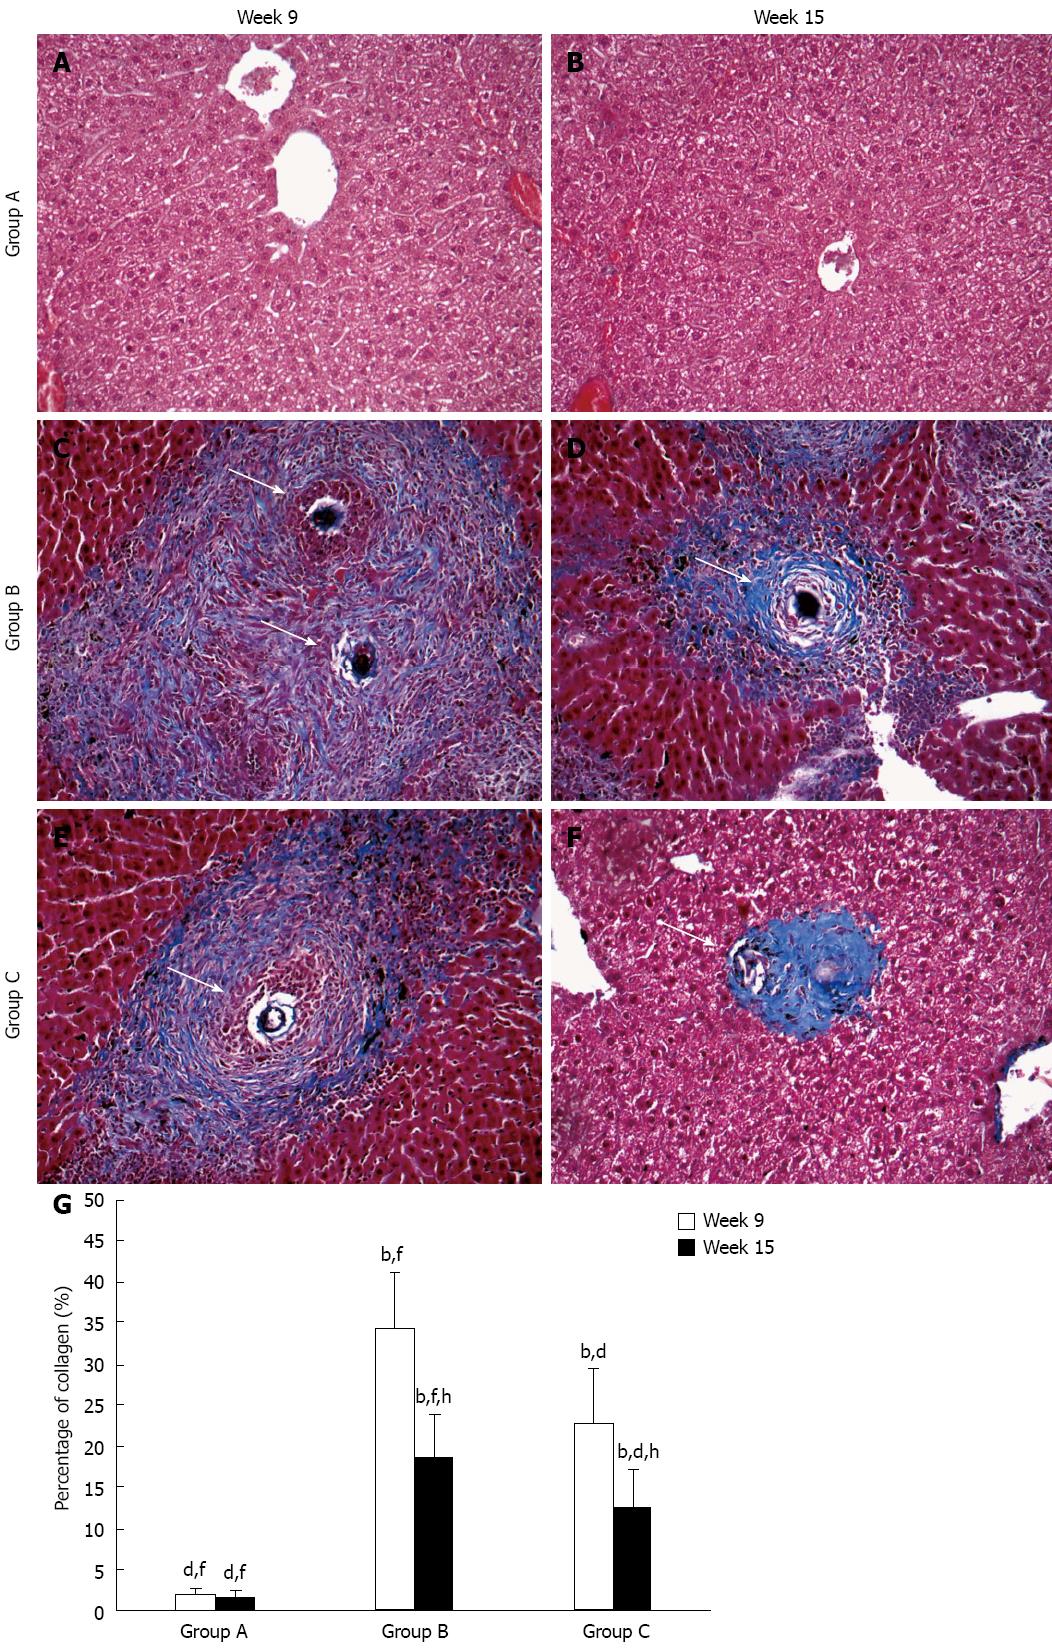
Figure 1 Representative images of schistosomal hepatic fibrosis in the groups over time.
Collagen fibers are stained blue and arrows show egg granulomas. Original magnification 100×. Histogram shows the percentage of collagen which represented the degree of hepatic fibrosis. bP < 0.01 vs group A; dP < 0.01 vs group B; fP < 0.01 vs group C; hP < 0.01 vs week 9.
-
Citation: Chen BL, Peng J, Li QF, Yang M, Wang Y, Chen W. Exogenous bone morphogenetic protein-7 reduces hepatic fibrosis in
Schistosoma japonicum -infected micevia transforming growth factor-β/Smad signaling. World J Gastroenterol 2013; 19(9): 1405-1415 - URL: https://www.wjgnet.com/1007-9327/full/v19/i9/1405.htm
- DOI: https://dx.doi.org/10.3748/wjg.v19.i9.1405


