Copyright
©2013 Baishideng Publishing Group Co.
World J Gastroenterol. Feb 28, 2013; 19(8): 1239-1246
Published online Feb 28, 2013. doi: 10.3748/wjg.v19.i8.1239
Published online Feb 28, 2013. doi: 10.3748/wjg.v19.i8.1239
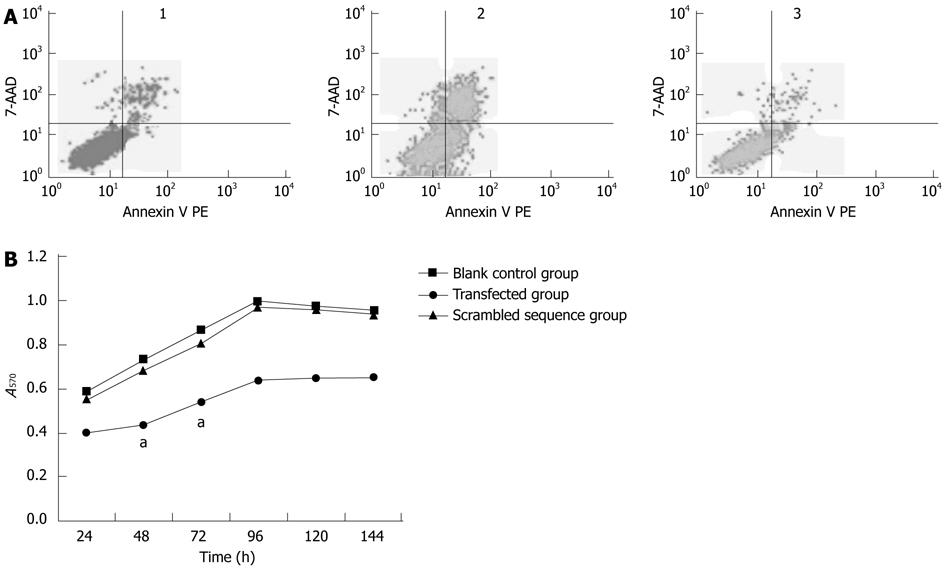
Figure 3 Apoptosis and cell proliferation analysis.
A: Flow cytometry. The cell apoptotic rate of the transfected group was significantly higher than those of the blank control group and the scrambled sequence group; B: Cell proliferation analysis. aP < 0.05 vs black control group. 1: Blank control group; 2: Transfected group; 3: Scrambled sequence group.
- Citation: Wei CH, Wei LX, Lai MY, Chen JZ, Mo XJ. Effect of silencing of high mobility group A2 gene on gastric cancer MKN-45 cells. World J Gastroenterol 2013; 19(8): 1239-1246
- URL: https://www.wjgnet.com/1007-9327/full/v19/i8/1239.htm
- DOI: https://dx.doi.org/10.3748/wjg.v19.i8.1239


