Copyright
©2013 Baishideng Publishing Group Co.
World J Gastroenterol. Feb 14, 2013; 19(6): 846-854
Published online Feb 14, 2013. doi: 10.3748/wjg.v19.i6.846
Published online Feb 14, 2013. doi: 10.3748/wjg.v19.i6.846
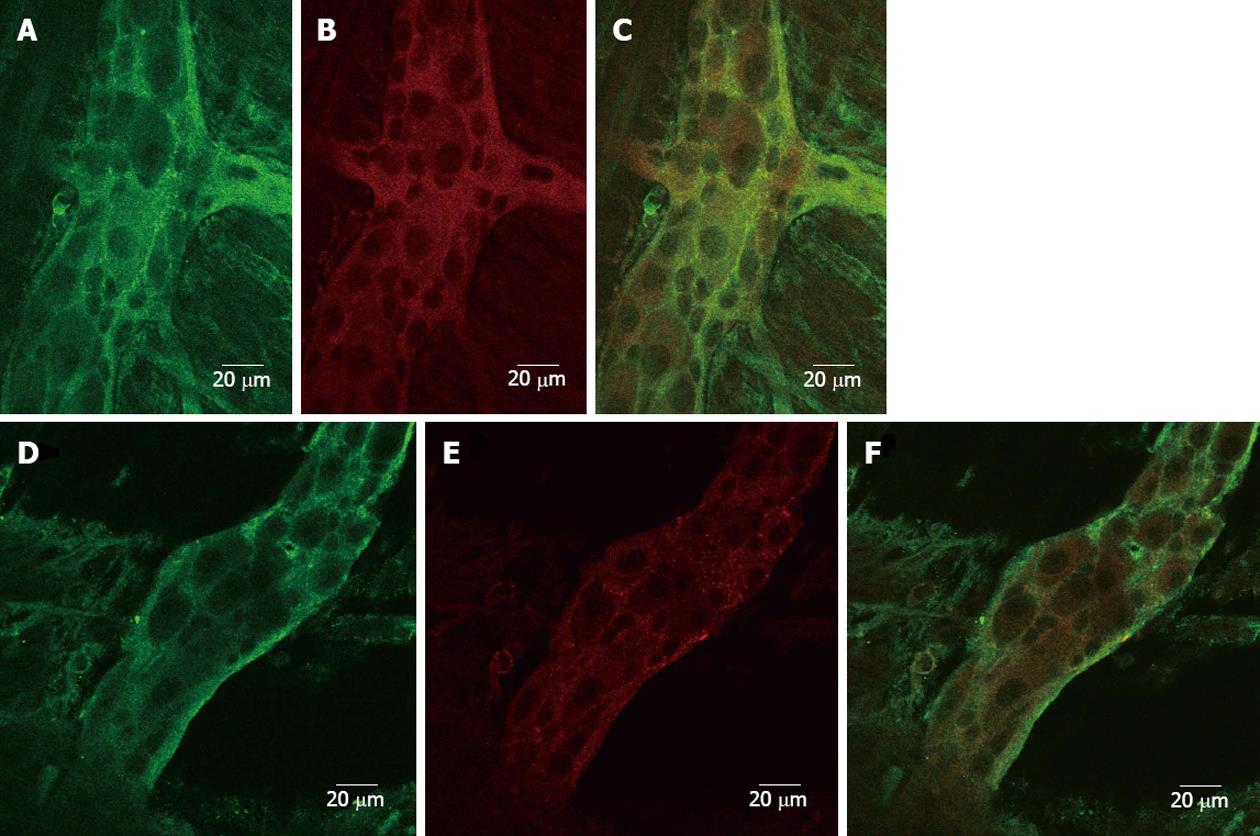
Figure 5 Cellular localization of 5-HT3 receptors in control and hypertrophic ileum.
Confocal images (0.5 μm sections; scale bar 20 μm) of myenteric plexus neurons isolated from control and hypertrophic ileal tissues. A: Image showing 5-HT3 receptor immunoreactivity visualized using donkey-anti-rabbit immunoglobulin G (IgG) conjugated with AlexaFluor 488 (green); B: Image showing clathrin immunoreactivity visualized using a donkey-anti-mouse IgG conjugated with Dylight 549 (red); C: Merged images from A and B; D: Image showing 5-HT3 receptor immunoreactivity visualized using donkey-anti-rabbit IgG conjugated with AlexaFluor 488 (green); E: Image showing clathrin immunoreactivity visualized using a donkey-anti-mouse IgG conjugated with Dylight 549 (red); F: Merged images from D and E.
- Citation: Bertoni S, Saccani F, Gatti R, Rapalli A, Flammini L, Ballabeni V, Barocelli E. Accommodation and peristalsis are functional responses to obstruction in rat hypertrophic ileum. World J Gastroenterol 2013; 19(6): 846-854
- URL: https://www.wjgnet.com/1007-9327/full/v19/i6/846.htm
- DOI: https://dx.doi.org/10.3748/wjg.v19.i6.846


