Copyright
©2013 Baishideng Publishing Group Co.
World J Gastroenterol. Feb 14, 2013; 19(6): 829-837
Published online Feb 14, 2013. doi: 10.3748/wjg.v19.i6.829
Published online Feb 14, 2013. doi: 10.3748/wjg.v19.i6.829
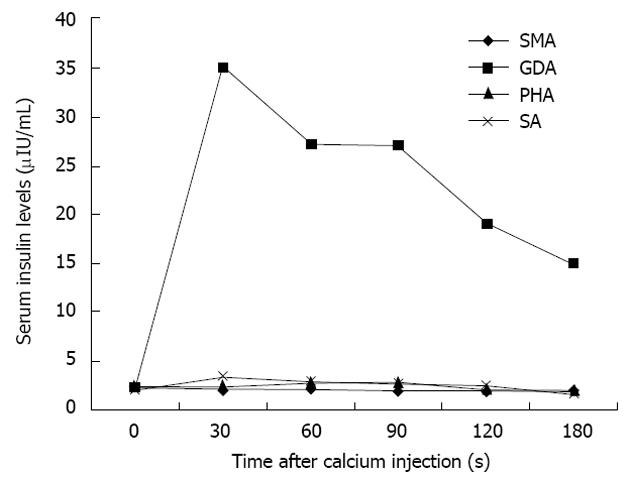
Figure 5 Changes in serum insulin levels.
Changes in serum insulin levels plotted as a function of time after calcium injection indicate that insulin concentrations are markedly elevated only in the feeding arteries of the insulinoma. SMA: Superior mesenteric artery; GDA: Gastroduodenal artery; PHA: Proper hepatic artery; SA: Splenic artery.
- Citation: Okabayashi T, Shima Y, Sumiyoshi T, Kozuki A, Ito S, Ogawa Y, Kobayashi M, Hanazaki K. Diagnosis and management of insulinoma. World J Gastroenterol 2013; 19(6): 829-837
- URL: https://www.wjgnet.com/1007-9327/full/v19/i6/829.htm
- DOI: https://dx.doi.org/10.3748/wjg.v19.i6.829


