Copyright
©2013 Baishideng Publishing Group Co.
World J Gastroenterol. Feb 7, 2013; 19(5): 781-783
Published online Feb 7, 2013. doi: 10.3748/wjg.v19.i5.781
Published online Feb 7, 2013. doi: 10.3748/wjg.v19.i5.781
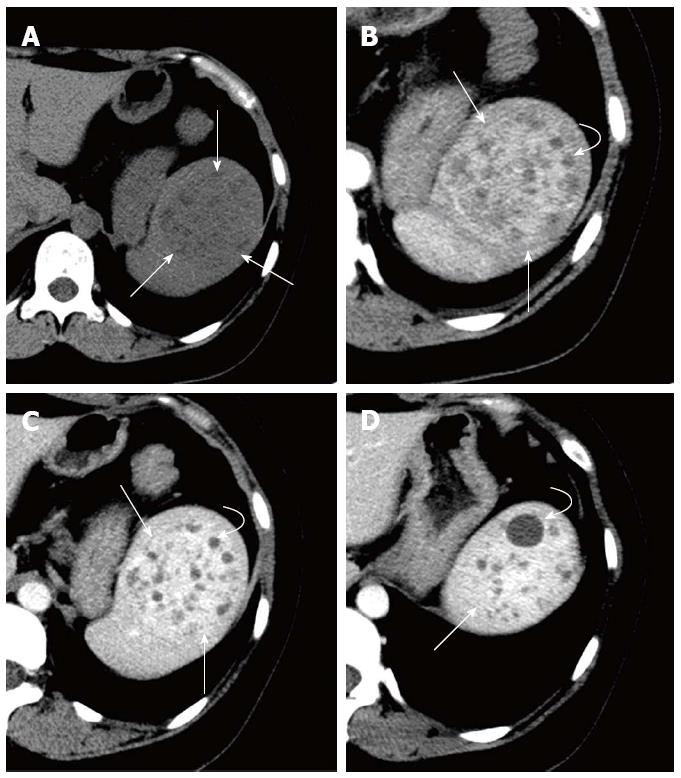
Figure 1 Computed tomography findings of the splenic lymphangioma.
A: A heterogeneous solid-cystic mass (straight arrow) with a well-defined margin in the spleen, as shown in the plain image. The solid components show slight hypo-density; B: Arterial phase image shows the mass (straight arrow) with multiple non-enhanced cysts (curved arrow). The solid portions manifest as obvious enhancement; C: Parenchyma phase image shows obviously progressive enhancement of the solid portions; D: Parenchyma phase image of the upper location of the mass showing the same presentation and enhancement pattern.
- Citation: Yang F, Chen WX. Splenic lymphangioma that manifested as a solid-cystic mass: A case report. World J Gastroenterol 2013; 19(5): 781-783
- URL: https://www.wjgnet.com/1007-9327/full/v19/i5/781.htm
- DOI: https://dx.doi.org/10.3748/wjg.v19.i5.781


