Copyright
©2013 Baishideng Publishing Group Co.
World J Gastroenterol. Feb 7, 2013; 19(5): 692-705
Published online Feb 7, 2013. doi: 10.3748/wjg.v19.i5.692
Published online Feb 7, 2013. doi: 10.3748/wjg.v19.i5.692
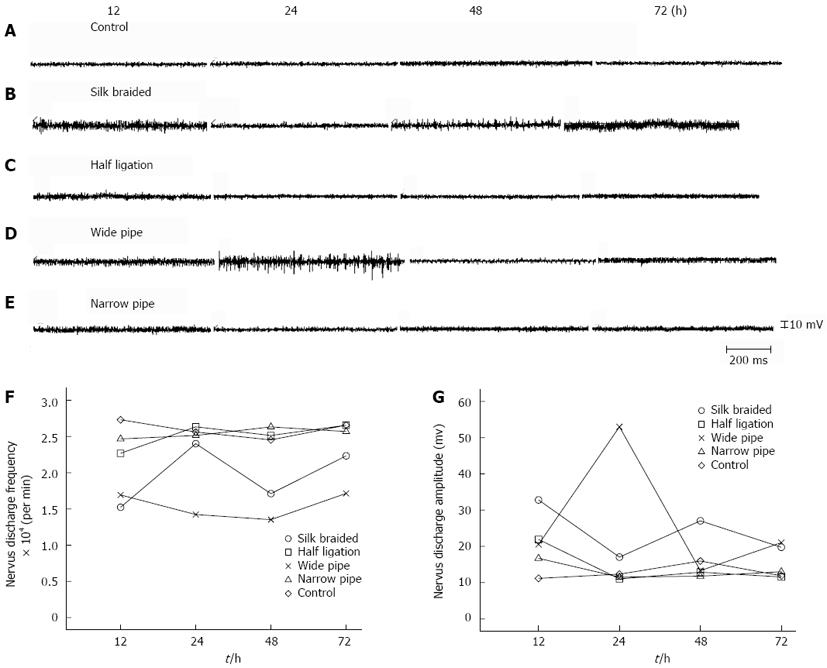
Figure 5 Changes in autonomic nerve electrical discharge.
Original traces of the vagus nerve in the obstructed and control ileum. A: Control; B: Braided silk; C: Half ligation; D: Wide pipe; E: Narrow pipe. The data illustrate typical traces of autonomic electrical discharge at different time points; F: Data of frequency of vagus electrical discharge showing autonomic nerve electrical activity; G: Data of amplitude of vagus electrical discharge showing autonomic nerve electrical activity.
- Citation: Yuan ML, Yang Z, Li YC, Shi LL, Guo JL, Huang YQ, Kang X, Cheng JJ, Chen Y, Yu T, Cao DQ, Pang H, Zhang X. Comparison of different methods of intestinal obstruction in a rat model. World J Gastroenterol 2013; 19(5): 692-705
- URL: https://www.wjgnet.com/1007-9327/full/v19/i5/692.htm
- DOI: https://dx.doi.org/10.3748/wjg.v19.i5.692


