Copyright
©2013 Baishideng Publishing Group Co.
World J Gastroenterol. Dec 28, 2013; 19(48): 9432-9438
Published online Dec 28, 2013. doi: 10.3748/wjg.v19.i48.9432
Published online Dec 28, 2013. doi: 10.3748/wjg.v19.i48.9432
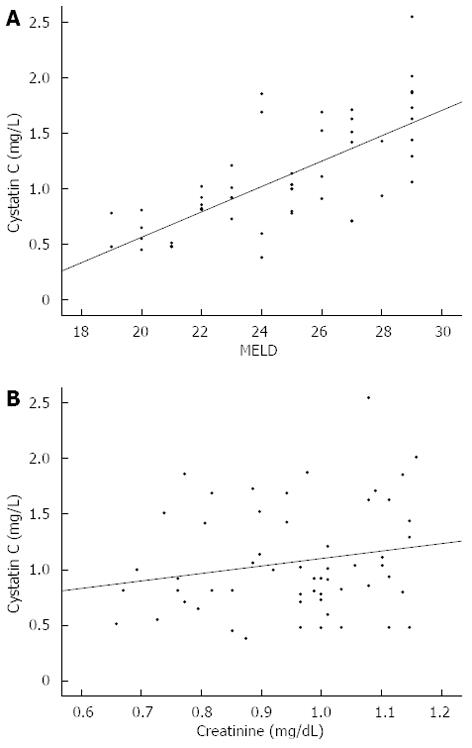
Figure 1 Scatter plots.
A: Serum cystatin C (CysC) level vs model for end-stage liver disease (MELD) score; B: Serum CysC level vs serum creatinine (Cr) level.
- Citation: Wan ZH, Wang JJ, You SL, Liu HL, Zhu B, Zang H, Li C, Chen J, Xin SJ. Cystatin C is a biomarker for predicting acute kidney injury in patients with acute-on-chronic liver failure. World J Gastroenterol 2013; 19(48): 9432-9438
- URL: https://www.wjgnet.com/1007-9327/full/v19/i48/9432.htm
- DOI: https://dx.doi.org/10.3748/wjg.v19.i48.9432


