Copyright
©2013 Baishideng Publishing Group Co.
World J Gastroenterol. Dec 28, 2013; 19(48): 9282-9293
Published online Dec 28, 2013. doi: 10.3748/wjg.v19.i48.9282
Published online Dec 28, 2013. doi: 10.3748/wjg.v19.i48.9282
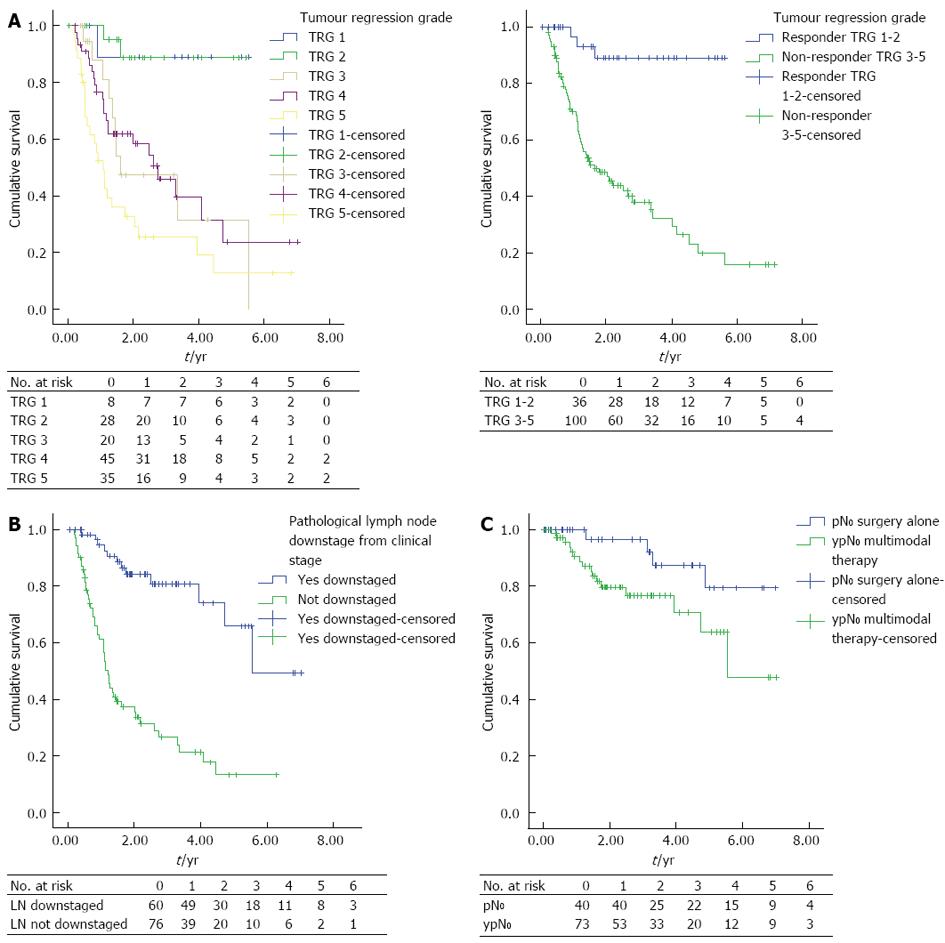
Figure 1 Kaplan-Meier curve of patients.
A: Patients (n = 136) received neoadjuvant chemotherapy grouped by tumour regression grade. Left: Tumour Regression Grade (TRG) 1-5 (P < 0.0001); Right: TRG 1-2 vs TRG 3-5 (P < 0.0001); B: Patients (n = 136) received neoadjuvant chemotherapy grouped by presence or absence of lymph node downstaging (P < 0.0001); C: Patients (n = 113) with no pathological lymph node metastasis grouped by treatment (P = 0.042).
- Citation: Noble F, Nolan L, Bateman AC, Byrne JP, Kelly JJ, Bailey IS, Sharland DM, Rees CN, Iveson TJ, Underwood TJ, Bateman AR. Refining pathological evaluation of neoadjuvant therapy for adenocarcinoma of the esophagus. World J Gastroenterol 2013; 19(48): 9282-9293
- URL: https://www.wjgnet.com/1007-9327/full/v19/i48/9282.htm
- DOI: https://dx.doi.org/10.3748/wjg.v19.i48.9282


