Copyright
©2013 Baishideng Publishing Group Co.
World J Gastroenterol. Dec 14, 2013; 19(46): 8678-8686
Published online Dec 14, 2013. doi: 10.3748/wjg.v19.i46.8678
Published online Dec 14, 2013. doi: 10.3748/wjg.v19.i46.8678
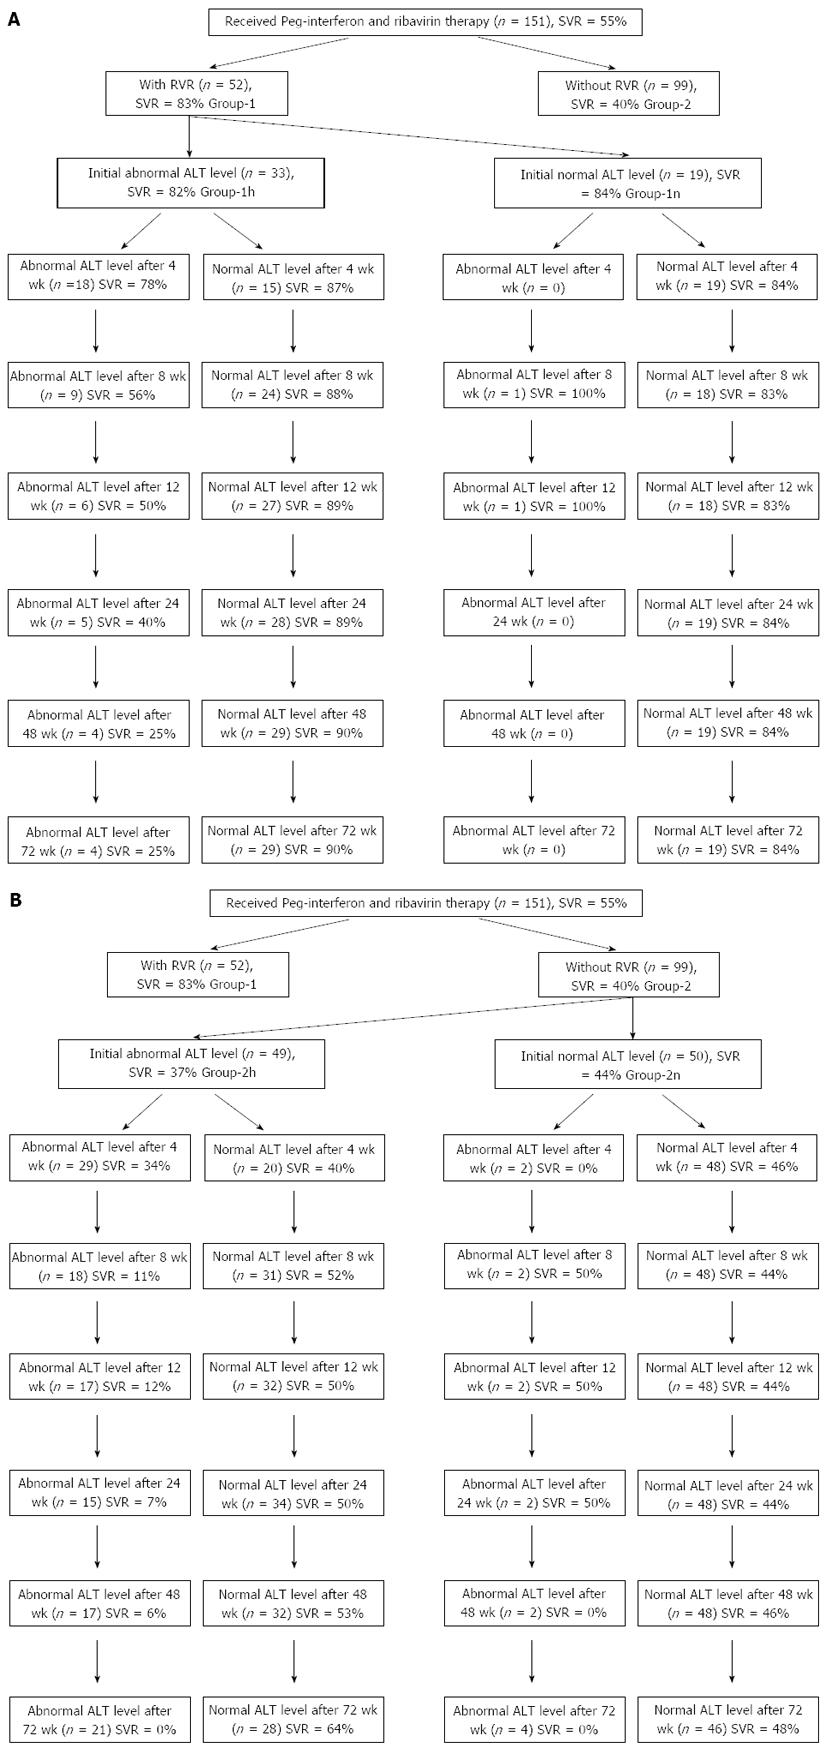
Figure 1 Schematic diagram showing patient group flow according to initial alanine aminotransferase level and subsequent pattern of change in patients with and without rapid virological response.
A: Change in patients with rapid virological response (RVR); B: Change in patients without RVR. ALT: Alanine aminotransferase; SVR: Sustained virological response.
- Citation: Dogan UB, Akin MS, Yalaki S. Alanine aminotransferase normalization at week 8 predicts viral response during hepatitis C treatment. World J Gastroenterol 2013; 19(46): 8678-8686
- URL: https://www.wjgnet.com/1007-9327/full/v19/i46/8678.htm
- DOI: https://dx.doi.org/10.3748/wjg.v19.i46.8678


