Copyright
©2013 Baishideng Publishing Group Co.
World J Gastroenterol. Dec 14, 2013; 19(46): 8502-8514
Published online Dec 14, 2013. doi: 10.3748/wjg.v19.i46.8502
Published online Dec 14, 2013. doi: 10.3748/wjg.v19.i46.8502
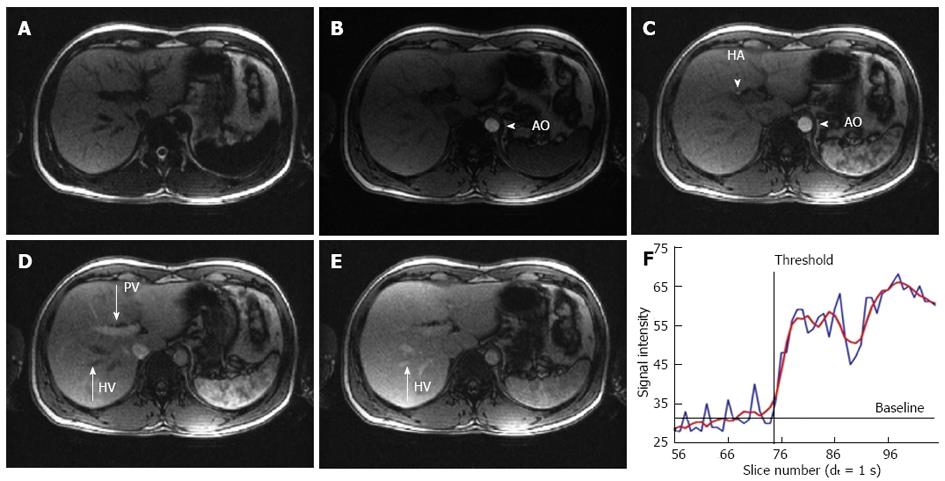
Figure 7 Magnetic resonance imaging images of the T1-weighted sequence for hepatic transit time analysis at different time points.
A: Baseline image without contrast; B: Arterial phase with opacification of the aorta (AO); C: Arterial phase with opacification of the AO and the hepatic artery (HA); D: Portal venous phase with additional enhancement of the portal vein (PV); Note that the hepatic veins (HV) are still not enhanced; E: Venous phase with complete opacification of all vessels including the HV; F: Example of a typical time intensity curve acquired from a ROI placed at the position of the HA; The raw data in the graph (blue line) has a modulation due to patient breathing. Therefore the curve has to be fitted and smoothed (red line). The calculated baseline as well as threshold point, demonstrating the arrival time of the contrast agent is drawn.
- Citation: Kekelidze M, D’Errico L, Pansini M, Tyndall A, Hohmann J. Colorectal cancer: Current imaging methods and future perspectives for the diagnosis, staging and therapeutic response evaluation. World J Gastroenterol 2013; 19(46): 8502-8514
- URL: https://www.wjgnet.com/1007-9327/full/v19/i46/8502.htm
- DOI: https://dx.doi.org/10.3748/wjg.v19.i46.8502


