Copyright
©2013 Baishideng Publishing Group Co.
World J Gastroenterol. Dec 7, 2013; 19(45): 8435-8439
Published online Dec 7, 2013. doi: 10.3748/wjg.v19.i45.8435
Published online Dec 7, 2013. doi: 10.3748/wjg.v19.i45.8435
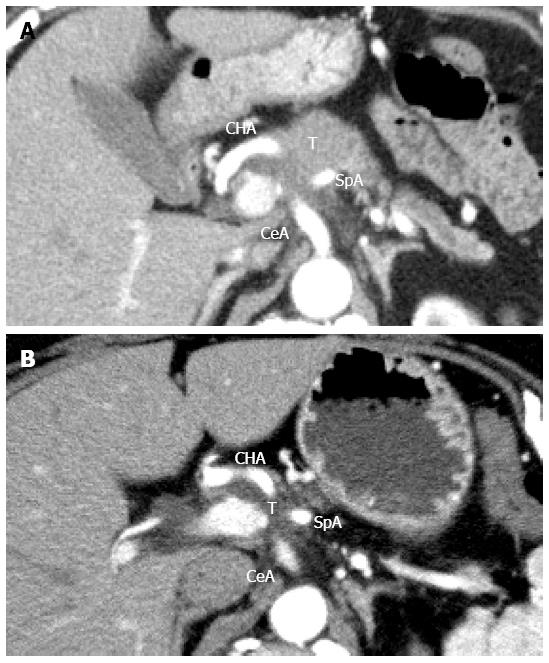
Figure 1 Computed tomography images before and after chemoradiation therapy.
A: Computed tomography (CT) image showing a 4.3 cm low-density pancreatic body tumor (T) that involves the common hepatic artery (CHA), splenic artery (SpA), and celiac axis (CeA); B: CT image showing obvious tumor shrinkage after chemoradiation therapy, although the tumor still involves the CHA, SpA, and CeA.
- Citation: Sumiyoshi T, Shima Y, Noda Y, Hosoki S, Hata Y, Okabayashi T, Kozuki A, Nakamura T. Endovascular pseudoaneurysm repair after distal pancreatectomy with celiac axis resection. World J Gastroenterol 2013; 19(45): 8435-8439
- URL: https://www.wjgnet.com/1007-9327/full/v19/i45/8435.htm
- DOI: https://dx.doi.org/10.3748/wjg.v19.i45.8435


