Copyright
©2013 Baishideng Publishing Group Co.
World J Gastroenterol. Dec 7, 2013; 19(45): 8373-8381
Published online Dec 7, 2013. doi: 10.3748/wjg.v19.i45.8373
Published online Dec 7, 2013. doi: 10.3748/wjg.v19.i45.8373
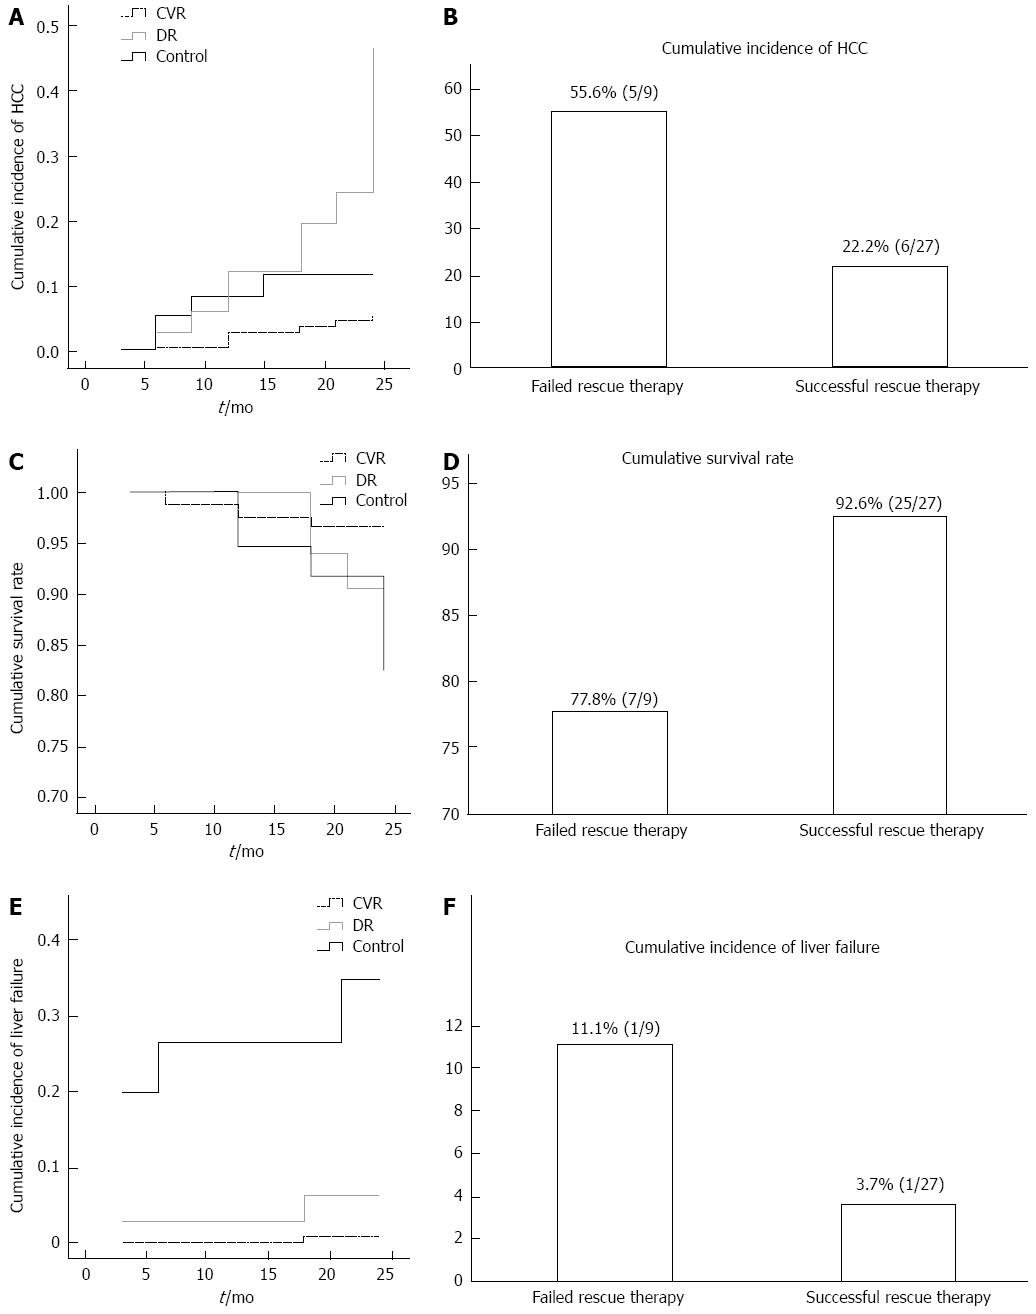
Figure 3 Kaplan-Meier curve.
Kaplan-Meier curve for incidence of hepatocellular carcinoma (HCC) in drug resistance (DR), complete virologic response (CVR) and control group was shown (A). The two-year cumulative incidence of HCC was extremely higher in rescue therapy failure group (B). However, no significant difference was seen in two years cumulative survival between DR group and CVR group as well as between the subgroup of failed rescue therapy and successful rescue therapy (C and D).The cumulative incidence of liver failure was higher in the control group than in the DR, CVR (E). However, there was no significant difference between failed rescue therapy and successful rescue therapy subgroups (F).
- Citation: Li L, Liu W, Chen YH, Fan CL, Dong PL, Wei FL, Li B, Chen DX, Ding HG. Antiviral drug resistance increases hepatocellular carcinoma: A prospective decompensated cirrhosis cohort study. World J Gastroenterol 2013; 19(45): 8373-8381
- URL: https://www.wjgnet.com/1007-9327/full/v19/i45/8373.htm
- DOI: https://dx.doi.org/10.3748/wjg.v19.i45.8373


