Copyright
©2013 Baishideng Publishing Group Co.
World J Gastroenterol. Dec 7, 2013; 19(45): 8366-8372
Published online Dec 7, 2013. doi: 10.3748/wjg.v19.i45.8366
Published online Dec 7, 2013. doi: 10.3748/wjg.v19.i45.8366
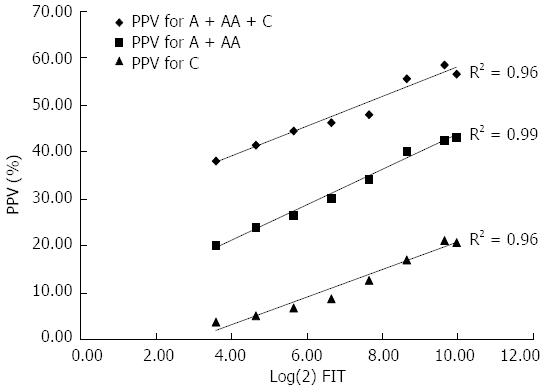
Figure 4 Fecal immunochemical test concentration in the prediction of colorectal neoplasia: linear regression analysis.
The association between FIT concentration with log(2) transformation (X-axis) and PPV (Y-axis). (all R2 > 0.95, P < 0.001). FIT: Fecal immunochemical test; O: Other; A: Adenoma; AA: Advanced adenoma; C: Cancer; PPV: Positive predictive value.
- Citation: Liao CS, Lin YM, Chang HC, Chen YH, Chong LW, Chen CH, Lin YS, Yang KC, Shih CH. Application of quantitative estimates of fecal hemoglobin concentration for risk prediction of colorectal neoplasia. World J Gastroenterol 2013; 19(45): 8366-8372
- URL: https://www.wjgnet.com/1007-9327/full/v19/i45/8366.htm
- DOI: https://dx.doi.org/10.3748/wjg.v19.i45.8366


