Copyright
©2013 Baishideng Publishing Group Co.
World J Gastroenterol. Nov 28, 2013; 19(44): 8133-8140
Published online Nov 28, 2013. doi: 10.3748/wjg.v19.i44.8133
Published online Nov 28, 2013. doi: 10.3748/wjg.v19.i44.8133
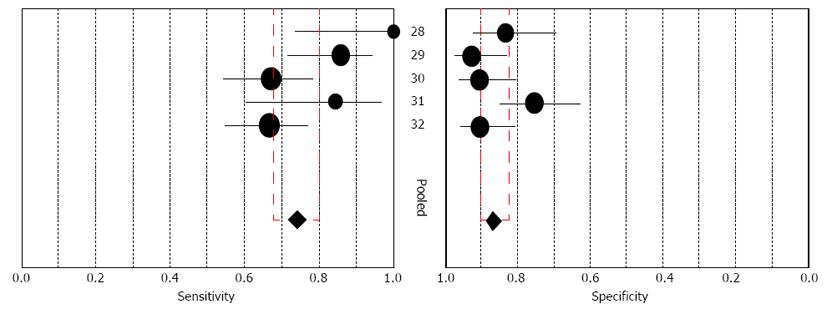
Figure 2 Forest plot of estimates of sensitivity and specificity for interferon-gamma release assays in the differential diagnosis of intestinal tuberculosis from Crohn’s disease.
Forest plot shows sensitivity and specificity of interferon-gamma release assays for intestinal tuberculosis diagnosis. The point estimates of sensitivity and specificity from each study are shown as solid circles. Error bars indicated 95%CI. Numbers indicate the studies included in the meta-analysis, as cited in the reference list. Pooled estimates for interferon-gamma release assays were as follows: sensitivity, 0.74 (95%CI: 0.68-0.80) and specificity, 0.87 (95%CI: 0.82-0.90).
- Citation: Chen W, Fan JH, Luo W, Peng P, Su SB. Effectiveness of interferon-gamma release assays for differentiating intestinal tuberculosis from Crohn’s disease: A meta-analysis. World J Gastroenterol 2013; 19(44): 8133-8140
- URL: https://www.wjgnet.com/1007-9327/full/v19/i44/8133.htm
- DOI: https://dx.doi.org/10.3748/wjg.v19.i44.8133


