Copyright
©2013 Baishideng Publishing Group Co.
World J Gastroenterol. Nov 28, 2013; 19(44): 8020-8027
Published online Nov 28, 2013. doi: 10.3748/wjg.v19.i44.8020
Published online Nov 28, 2013. doi: 10.3748/wjg.v19.i44.8020
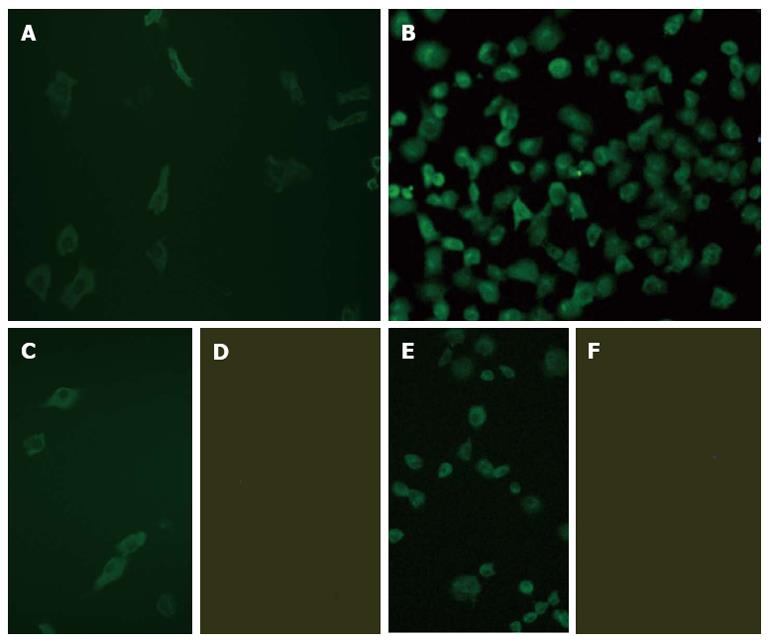
Figure 5 Analysis of hepatitis B surface antigen and hepatitis B c antigen expression in hepatitis B virus 1.
3-fold genome plasmids-transfected cells by immunofluorescence microscopy (× 200). A: Hepatitis B surface antigen (HBsAg) observed in the hepatitis B virus 1.3-fold genome plasmids (pHBV1.3)- transfected cells at 24 h post-transfection; B: Hepatitis B c antigen (HBcAg) observed in the pHBV1.3-transfected cells at 24 h post-transfection; C: HBsAg observed in HepG2.215 cells (positive control); D: HBsAg observed in untransfected SV40 T-antigen (SV40T)-immortalized cells (negative control); E: HBcAg observed in HepG2.215 cells (positive control); F: HBcAg observed in untransfected SV40T-immortalized cells (negative control).
- Citation: Song XG, Bian PF, Yu SL, Zhao XH, Xu W, Bu XH, Li X, Ma LX. Expression of hepatitis B virus 1.3-fold genome plasmid in an SV40 T-antigen-immortalized mouse hepatic cell line. World J Gastroenterol 2013; 19(44): 8020-8027
- URL: https://www.wjgnet.com/1007-9327/full/v19/i44/8020.htm
- DOI: https://dx.doi.org/10.3748/wjg.v19.i44.8020


