Copyright
©2013 Baishideng Publishing Group Co.
World J Gastroenterol. Nov 14, 2013; 19(42): 7247-7257
Published online Nov 14, 2013. doi: 10.3748/wjg.v19.i42.7247
Published online Nov 14, 2013. doi: 10.3748/wjg.v19.i42.7247
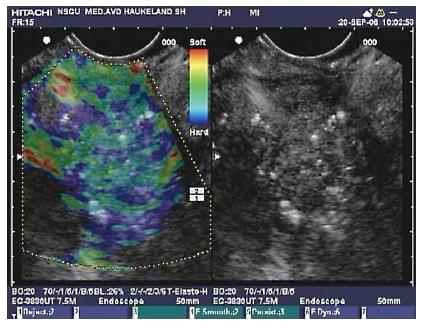
Figure 5 Endoscopic ultrasound with elastography of chronic pancreatitis.
Endoscopic ultrasonography B-mode sonogram (right) and an elastogram superimposed a sonogram (left). In this image of the pancreatic head, hyperechoic foci and strands are seen in the parenchyma, as well as inhomogeneous echogenecity, which are signs of chronic pancreatitis. The elastogram shows predominantly a blue, indicating harder tissue, and green representing intermediate hardness in a honeycomb pattern over the pancreatic tissue.
- Citation: Dimcevski G, Erchinger FG, Havre R, Gilja OH. Ultrasonography in diagnosing chronic pancreatitis: New aspects. World J Gastroenterol 2013; 19(42): 7247-7257
- URL: https://www.wjgnet.com/1007-9327/full/v19/i42/7247.htm
- DOI: https://dx.doi.org/10.3748/wjg.v19.i42.7247


