Copyright
©2013 Baishideng Publishing Group Co.
World J Gastroenterol. Oct 14, 2013; 19(38): 6416-6426
Published online Oct 14, 2013. doi: 10.3748/wjg.v19.i38.6416
Published online Oct 14, 2013. doi: 10.3748/wjg.v19.i38.6416
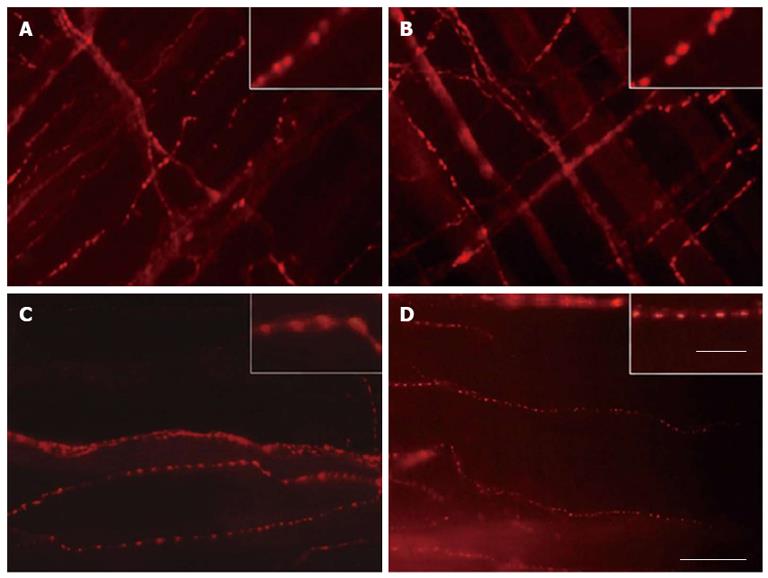
Figure 3 Representative micrographs showing immunoreactivity to vasoactive intestinal peptide in the myenteric plexus of the rat cecum.
A: Control group; B: Quercetin supplemented control group; C: Diabetic group; D: Quercetin supplemented diabetic group. Magnified inserts show varicosities of the individual nerve fibers. Note the enlarged appearance of the varicosities in the diabetic group (C) and the reduced varicosities in the quercetin diabetic group (D) compared with the controls (A and B). Scale bars = 50 μm for main panels, 15 μm for inserts.
- Citation: Ferreira PEB, Lopes CRP, Alves AMP, Alves &PB, Linden DR, Zanoni JN, Buttow NC. Diabetic neuropathy: An evaluation of the use of quercetin in the cecum of rats. World J Gastroenterol 2013; 19(38): 6416-6426
- URL: https://www.wjgnet.com/1007-9327/full/v19/i38/6416.htm
- DOI: https://dx.doi.org/10.3748/wjg.v19.i38.6416


