Copyright
©2013 Baishideng Publishing Group Co.
World J Gastroenterol. Oct 14, 2013; 19(38): 6353-6359
Published online Oct 14, 2013. doi: 10.3748/wjg.v19.i38.6353
Published online Oct 14, 2013. doi: 10.3748/wjg.v19.i38.6353
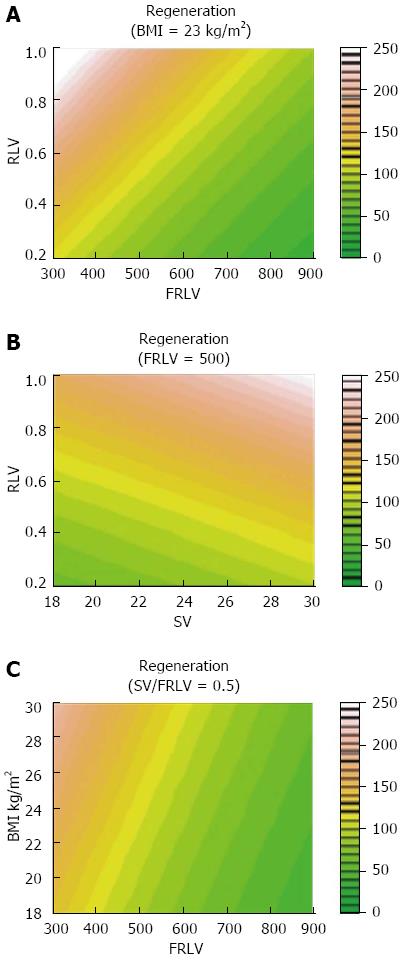
Figure 2 Locally Weighted Scatterplot Smoother graphics of the overall population, evidencing the association of percentage of liver regeneration with levels of body mass index (A), future remnant liver volume (B) and spleen volume/future remnant liver volume (C).
FRLV: Future remnant liver volume; SV: Spleen volume; BMI: Body mass index.
- Citation: Gruttadauria S, Pagano D, Cintorino D, Arcadipane A, Traina M, Volpes R, Luca A, Vizzini G, Gridelli B, Spada M. Right hepatic lobe living donation: A 12 years single Italian center experience. World J Gastroenterol 2013; 19(38): 6353-6359
- URL: https://www.wjgnet.com/1007-9327/full/v19/i38/6353.htm
- DOI: https://dx.doi.org/10.3748/wjg.v19.i38.6353


