Copyright
©2013 Baishideng Publishing Group Co.
World J Gastroenterol. Oct 7, 2013; 19(37): 6170-6177
Published online Oct 7, 2013. doi: 10.3748/wjg.v19.i37.6170
Published online Oct 7, 2013. doi: 10.3748/wjg.v19.i37.6170
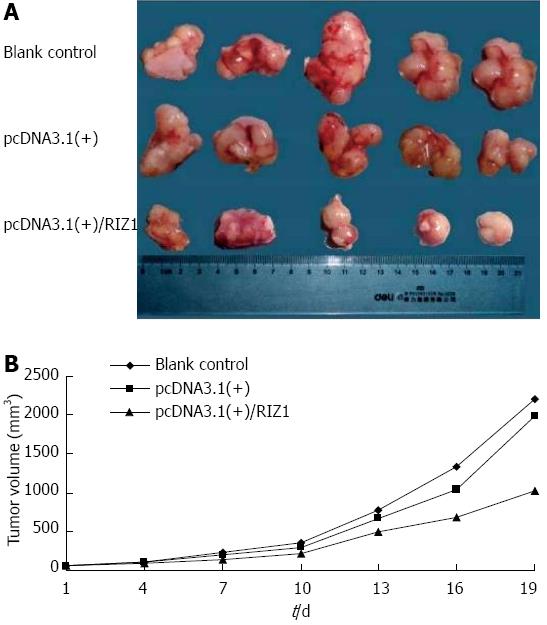
Figure 6 Transplantation and tumor growth.
A: Photograph comparing esophageal squamous cell carcinomas removed from nude mice of the three groups after 26 d; B: Growth rate curves showing the increase in tumor volumes with time. The shallower curve in the pcDNA3.1(+)/RIZ1 group, compared to the blank control and pcDNA3.1(+) groups, indicates slower growth.
-
Citation: Dong SW, Li D, Xu C, Sun P, Wang YG, Zhang P. Alteration in gene expression profile and oncogenicity of esophageal squamous cell carcinoma by
RIZ1 upregulation. World J Gastroenterol 2013; 19(37): 6170-6177 - URL: https://www.wjgnet.com/1007-9327/full/v19/i37/6170.htm
- DOI: https://dx.doi.org/10.3748/wjg.v19.i37.6170


