Copyright
©2013 Baishideng Publishing Group Co.
World J Gastroenterol. Oct 7, 2013; 19(37): 6170-6177
Published online Oct 7, 2013. doi: 10.3748/wjg.v19.i37.6170
Published online Oct 7, 2013. doi: 10.3748/wjg.v19.i37.6170
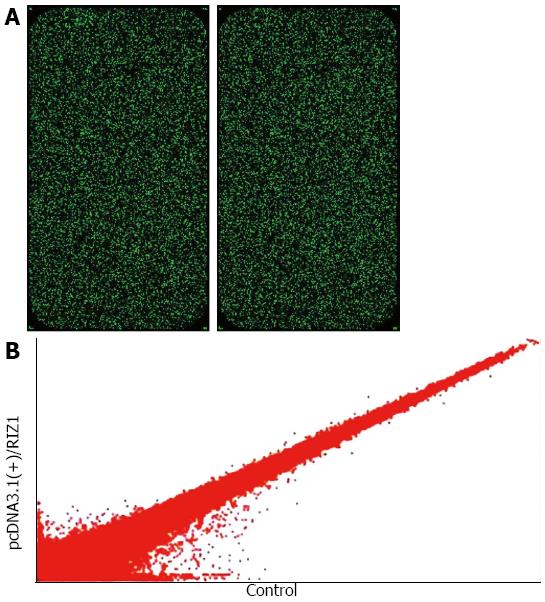
Figure 3 Alteration of gene expression profile.
A: Single fluorescence chip images for microarray analysis; B: The data were used to construct the scatter plot. Hybridization signal strength scatter diagram. Each point in the scatter diagram represents a probe point on the chip. The position of each point is identified by an x and y coordinate: the x-coordinate gives the standardized signal value on the control chip; the y-coordinate gives the standardized signal value on the sample chip. The scatter plot is used to assess the centralized tendency of two sets of data.
-
Citation: Dong SW, Li D, Xu C, Sun P, Wang YG, Zhang P. Alteration in gene expression profile and oncogenicity of esophageal squamous cell carcinoma by
RIZ1 upregulation. World J Gastroenterol 2013; 19(37): 6170-6177 - URL: https://www.wjgnet.com/1007-9327/full/v19/i37/6170.htm
- DOI: https://dx.doi.org/10.3748/wjg.v19.i37.6170


