Copyright
©2013 Baishideng Publishing Group Co.
World J Gastroenterol. Sep 14, 2013; 19(34): 5759-5762
Published online Sep 14, 2013. doi: 10.3748/wjg.v19.i34.5759
Published online Sep 14, 2013. doi: 10.3748/wjg.v19.i34.5759
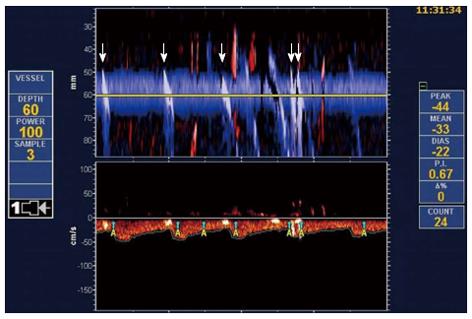
Figure 4 Transcranial Doppler bubble test showing the Doppler flow through the middle cerebral artery.
The embolus is clearly represented in the power M-mode (upper panel) as a whitish sloping track. The whitish sloping track means that microemboli disrupt the ultrasonic signal (arrows).
-
Citation: Myung DS, Chung CY, Park HC, Kim JS, Cho SB, Lee WS, Choi SK, Joo YE. Cerebral and splenic infarctions after injection of
N -butyl-2-cyanoacrylate in esophageal variceal bleeding. World J Gastroenterol 2013; 19(34): 5759-5762 - URL: https://www.wjgnet.com/1007-9327/full/v19/i34/5759.htm
- DOI: https://dx.doi.org/10.3748/wjg.v19.i34.5759


