Copyright
©2013 Baishideng Publishing Group Co.
World J Gastroenterol. Sep 14, 2013; 19(34): 5713-5719
Published online Sep 14, 2013. doi: 10.3748/wjg.v19.i34.5713
Published online Sep 14, 2013. doi: 10.3748/wjg.v19.i34.5713
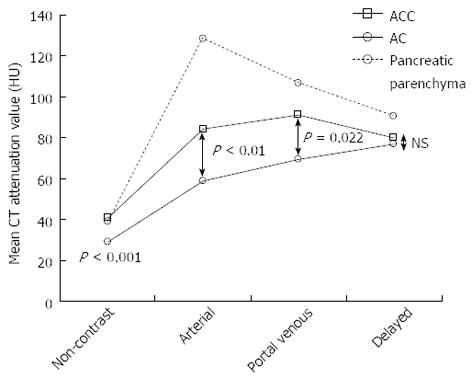
Figure 5 Mean computed tomography attenuation values of the tumors and the surrounding pancreatic parenchyma in the 4 phases.
In 3 phases (non-contrast, arterial, and portal venous phase), the computed tomography (CT) attenuation values of the acinar cell carcinomas (ACCs) were significantly higher than those of the adenocarcinomas (ACs). NS: Not significant.
- Citation: Sumiyoshi T, Shima Y, Okabayashi T, Kozuki A, Nakamura T. Comparison of pancreatic acinar cell carcinoma and adenocarcinoma using multidetector-row computed tomography. World J Gastroenterol 2013; 19(34): 5713-5719
- URL: https://www.wjgnet.com/1007-9327/full/v19/i34/5713.htm
- DOI: https://dx.doi.org/10.3748/wjg.v19.i34.5713


