Copyright
©2013 Baishideng Publishing Group Co.
World J Gastroenterol. Sep 7, 2013; 19(33): 5520-5527
Published online Sep 7, 2013. doi: 10.3748/wjg.v19.i33.5520
Published online Sep 7, 2013. doi: 10.3748/wjg.v19.i33.5520
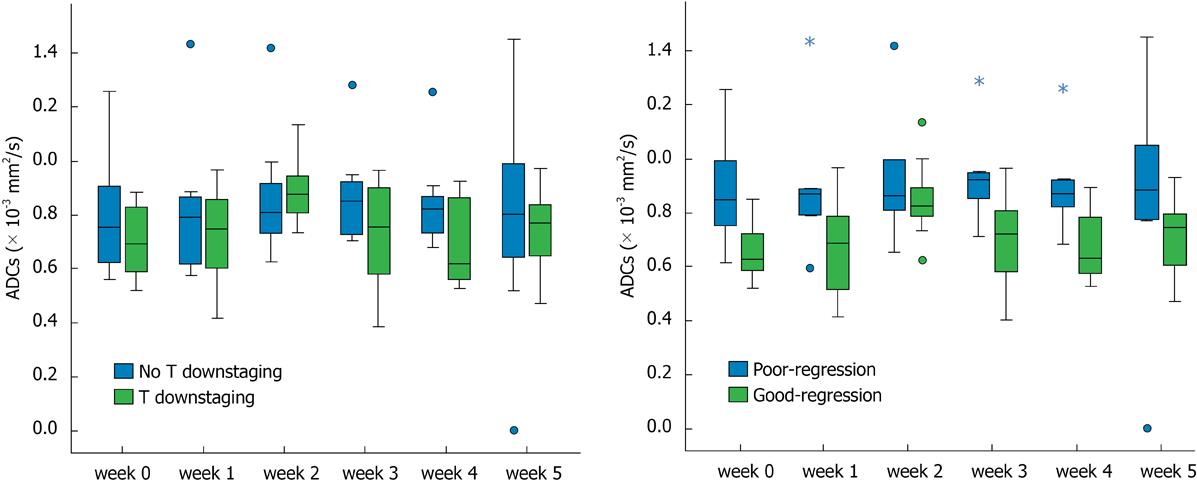
Figure 3 Mean tumor apparent diffusion coefficient values in patients at six measurement points.
A: With and without T downstaging; B: With good regressin and poor regression. Cycle: Outlier; Star: Extreme value.
- Citation: Cai G, Xu Y, Zhu J, Gu WL, Zhang S, Ma XJ, Cai SJ, Zhang Z. Diffusion-weighted magnetic resonance imaging for predicting the response of rectal cancer to neoadjuvant concurrent chemoradiation. World J Gastroenterol 2013; 19(33): 5520-5527
- URL: https://www.wjgnet.com/1007-9327/full/v19/i33/5520.htm
- DOI: https://dx.doi.org/10.3748/wjg.v19.i33.5520


