Copyright
©2013 Baishideng Publishing Group Co.
World J Gastroenterol. Aug 28, 2013; 19(32): 5347-5356
Published online Aug 28, 2013. doi: 10.3748/wjg.v19.i32.5347
Published online Aug 28, 2013. doi: 10.3748/wjg.v19.i32.5347
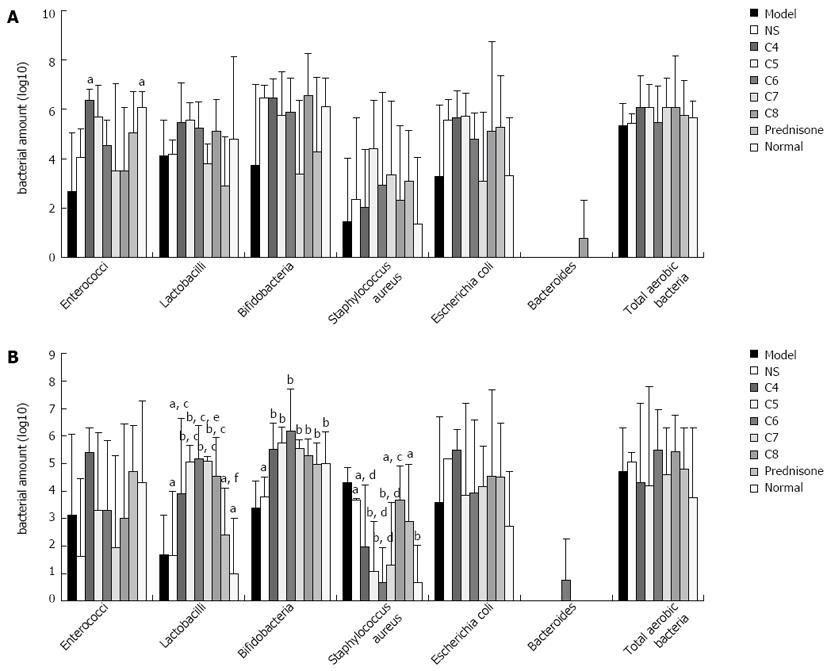
Figure 5 Bacterial profiles of the proximal (A) and distal (B) colon.
Bacteria amount is expressed as the logarithm. aP < 0.05, bP < 0.01 vs untreated model control group; cP < 0.05, dP < 0.01 vs positive-treatment (prednisone acetate) model control group; eP < 0.05, fP < 0.01 vs normal control group. NS: Negative-treatment.
-
Citation: Chen LL, Zou YY, Lu FG, Li FJ, Lian GH. Efficacy profiles for different concentrations of
Lactobacillus acidophilus in experimental colitis. World J Gastroenterol 2013; 19(32): 5347-5356 - URL: https://www.wjgnet.com/1007-9327/full/v19/i32/5347.htm
- DOI: https://dx.doi.org/10.3748/wjg.v19.i32.5347


