Copyright
©2013 Baishideng Publishing Group Co.
World J Gastroenterol. Aug 21, 2013; 19(31): 5076-5084
Published online Aug 21, 2013. doi: 10.3748/wjg.v19.i31.5076
Published online Aug 21, 2013. doi: 10.3748/wjg.v19.i31.5076
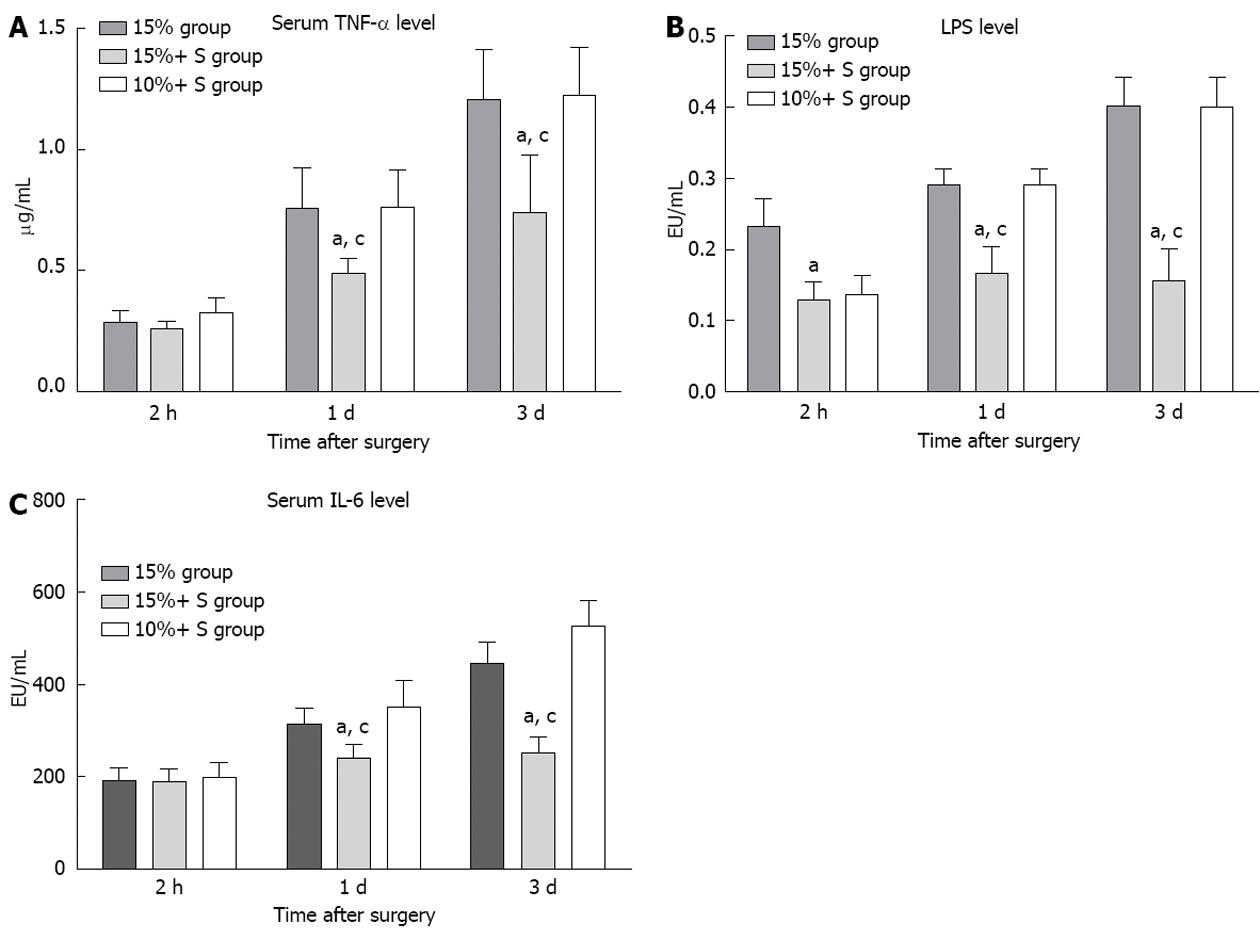
Figure 7 Serial changes in the serum lipopolysaccharides, tumor necrosis factor-α, and interleukin-6 level in three groups, in which significant differences were noted.
A: Serum level of tumor necrosis factor-α (TNF-α); B: Serum level of lipopolysaccharides (LPS); C: Serum level of interleukin-6 (IL-6). aP < 0.05 vs 15% group; cP < 0.05 vs 10%+ S group.
- Citation: Tu YL, Wang X, Wang DD, Zhu ZM, Tan JW. Impact of mesocaval shunt on safe minimal liver remnant: Porcine model. World J Gastroenterol 2013; 19(31): 5076-5084
- URL: https://www.wjgnet.com/1007-9327/full/v19/i31/5076.htm
- DOI: https://dx.doi.org/10.3748/wjg.v19.i31.5076


