Copyright
©2013 Baishideng Publishing Group Co.
World J Gastroenterol. Jan 21, 2013; 19(3): 362-365
Published online Jan 21, 2013. doi: 10.3748/wjg.v19.i3.362
Published online Jan 21, 2013. doi: 10.3748/wjg.v19.i3.362
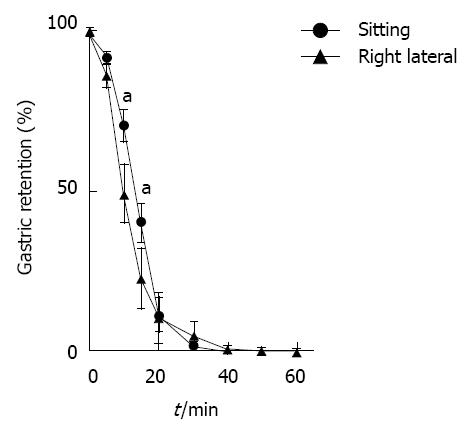
Figure 2 Percent gastric retention-time curves created by Wagner-Nelson analysis.
Error bars indicate SE. The asterisk indicates a significant difference (aP < 0.05 vs right lateral group).
- Citation: Sanaka M, Urita Y, Yamamoto T, Shirai T, Kimura S, Aoyagi H, Kuyama Y. Right recumbent position on gastric emptying of water evidenced by 13C breath testing. World J Gastroenterol 2013; 19(3): 362-365
- URL: https://www.wjgnet.com/1007-9327/full/v19/i3/362.htm
- DOI: https://dx.doi.org/10.3748/wjg.v19.i3.362


