Copyright
©2013 Baishideng Publishing Group Co.
World J Gastroenterol. Jul 21, 2013; 19(27): 4289-4299
Published online Jul 21, 2013. doi: 10.3748/wjg.v19.i27.4289
Published online Jul 21, 2013. doi: 10.3748/wjg.v19.i27.4289
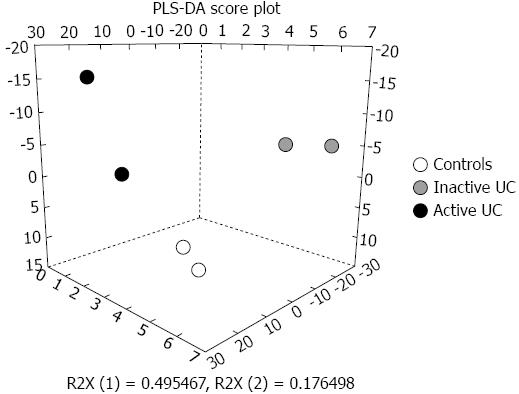
Figure 1 Projection to latent structure-discriminant analysis score-plot of the miRNA microarray expression profiles from mucosal colonic biopsies of controls, active ulcerative colitis, and inactive ulcerative colitis reveals a clear separation of these three groups.
All patient with active ulcerative colitis (UC) are positioned in the left part of the space, and all patients with inactive UC are placed in the right space, whereas all control subjects are found in the middle. PLS-DA: Projection to latent structure-discriminant analysis.
- Citation: Coskun M, Bjerrum JT, Seidelin JB, Troelsen JT, Olsen J, Nielsen OH. miR-20b, miR-98, miR-125b-1*, and let-7e* as new potential diagnostic biomarkers in ulcerative colitis. World J Gastroenterol 2013; 19(27): 4289-4299
- URL: https://www.wjgnet.com/1007-9327/full/v19/i27/4289.htm
- DOI: https://dx.doi.org/10.3748/wjg.v19.i27.4289


