Copyright
©2013 Baishideng Publishing Group Co.
World J Gastroenterol. Jul 14, 2013; 19(26): 4137-4145
Published online Jul 14, 2013. doi: 10.3748/wjg.v19.i26.4137
Published online Jul 14, 2013. doi: 10.3748/wjg.v19.i26.4137
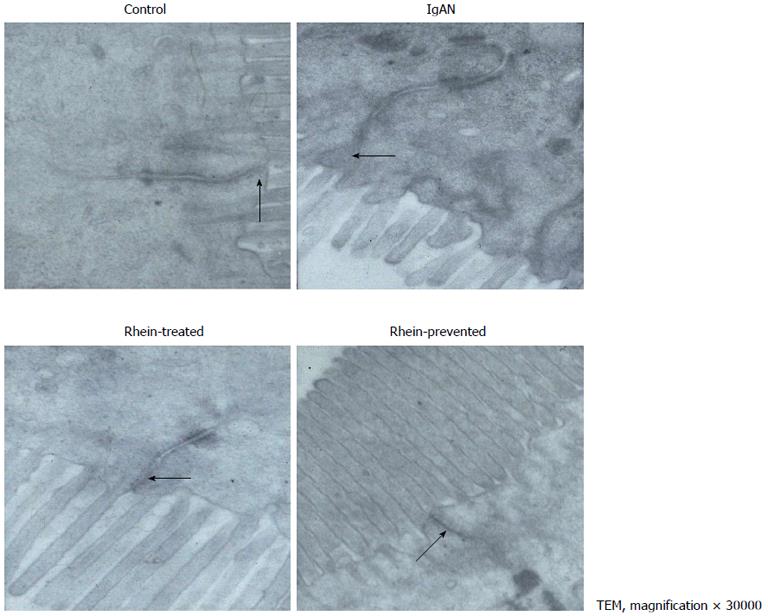
Figure 1 Electron micrograph of intestinal epithelial cells showing tight junction.
A: In the control group, the tight junction appeared as an electron-dense belt at the apex of the intestinal epithelial cells (arrow), indicating an intact intestinal mucosal barrie; B: In the IgA nephropathy (IgAN) group group, the intercellular space was widened, the tight junction was indistinct, and the density was reduced (arrow); C and D: In the Rhein-treated and Rhein-prevented groups, the density of the tight junctions was increased compared with that in the IgAN group (arrows). TEM: Transmission electron microscopy.
- Citation: Peng SN, Zeng HH, Fu AX, Chen XW, Zhu QX. Effects of rhein on intestinal epithelial tight junction in IgA nephropathy. World J Gastroenterol 2013; 19(26): 4137-4145
- URL: https://www.wjgnet.com/1007-9327/full/v19/i26/4137.htm
- DOI: https://dx.doi.org/10.3748/wjg.v19.i26.4137


