Copyright
©2013 Baishideng Publishing Group Co.
World J Gastroenterol. Jun 28, 2013; 19(24): 3883-3891
Published online Jun 28, 2013. doi: 10.3748/wjg.v19.i24.3883
Published online Jun 28, 2013. doi: 10.3748/wjg.v19.i24.3883
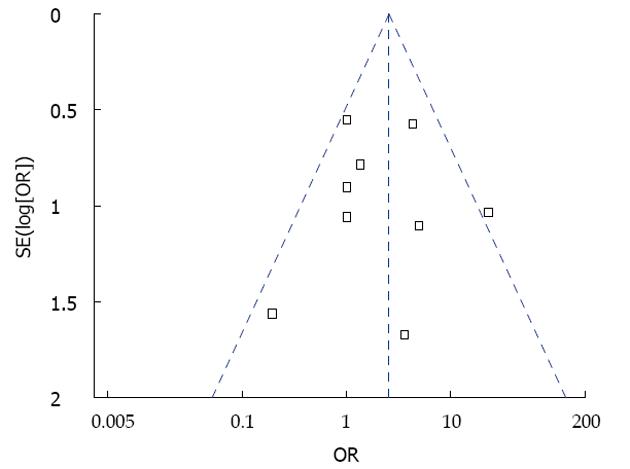
Figure 5 Funnel plot analysis of included studies.
X-axis [Peto odds ratio (OR)] represents treatment effects. Y-axis (log[Peto OR]) represents the large sample size. Each square represents an individual study. The dashed line represents 95%CI.
- Citation: Zhao HC, He L, Zhou DC, Geng XP, Pan FM. Meta-analysis comparison of endoscopic papillary balloon dilatation and endoscopic sphincteropapillotomy. World J Gastroenterol 2013; 19(24): 3883-3891
- URL: https://www.wjgnet.com/1007-9327/full/v19/i24/3883.htm
- DOI: https://dx.doi.org/10.3748/wjg.v19.i24.3883


