Copyright
©2013 Baishideng Publishing Group Co.
World J Gastroenterol. Jun 28, 2013; 19(24): 3831-3840
Published online Jun 28, 2013. doi: 10.3748/wjg.v19.i24.3831
Published online Jun 28, 2013. doi: 10.3748/wjg.v19.i24.3831
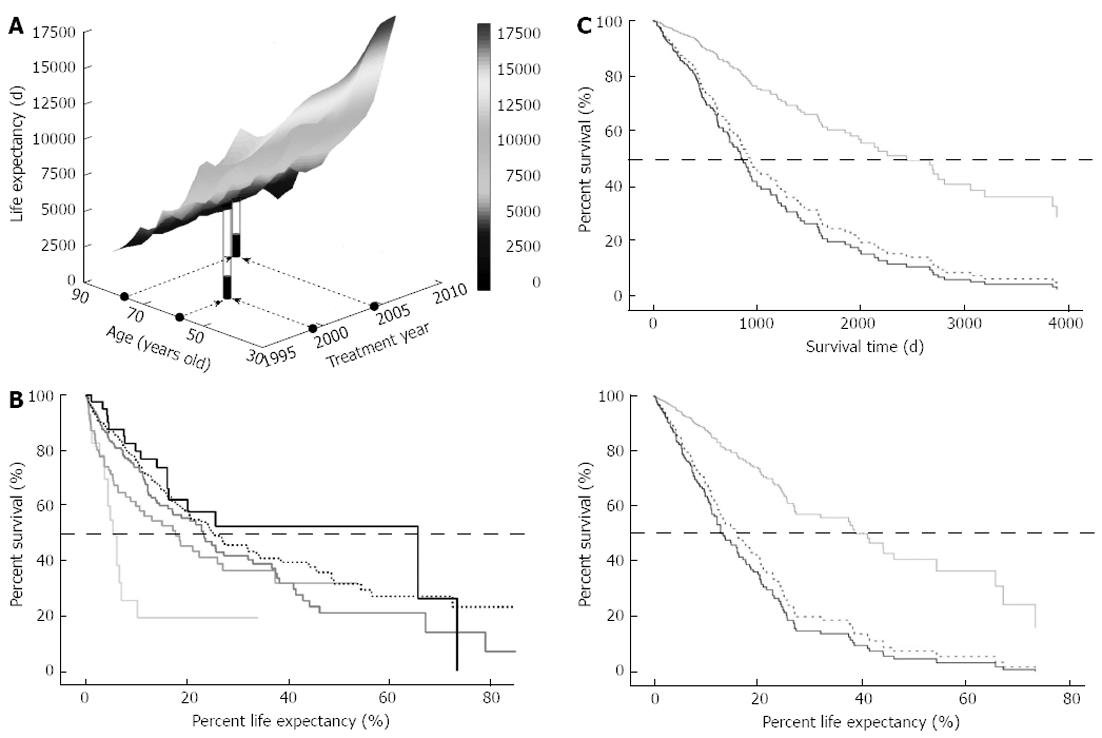
Figure 2 Life expectancy and percent life expectancy of patients with hepatocellular carcinoma.
A: Life expectancy (LE) for each case was plotted in a three-dimensional space. The percent LE (%LE) was defined as the ratio between survival time and LE and is shown for representative cases. The LE of a male at 59 years of age in the year 1999 is 7928 d, whereas the LE is 3760 d for a 77-year-old male in the year 2004 (white piles). Both patients survived for 1779 d, as indicated by the black piles, with %LE values of 22.4% and 48.6%, respectively; B: A survival proportion was expressed in %LE in the five different age groups, and the median %LE of all 504 cases was 22.9%. The solid black and dotted lines are the survival curves of 80 years of age or older and 70-79 years of age group, respectively. The other lines represent 60-69 years of age, 50-59 years of age and 49 years of age or younger groups, in colors ranging from dark to pale, respectively; C: In a cohort of 328 patients for whom LE is available, the survival among patients receiving loco-regional, interventional radiology (IVR), or chemotherapy (Cx) treatments was evaluated on the basis of absolute time (upper panel) or %LE (lower panel). The solid black and dotted lines are survival curves for Cx and IVR, respectively, and the gray line represents the loco-regional group. The dotted horizontal lines indicate a position of 50% survival.
- Citation: Suda T, Nagashima A, Takahashi S, Kanefuji T, Kamimura K, Tamura Y, Takamura M, Igarashi M, Kawai H, Yamagiwa S, Nomoto M, Aoyagi Y. Active treatments are a rational approach for hepatocellular carcinoma in elderly patients. World J Gastroenterol 2013; 19(24): 3831-3840
- URL: https://www.wjgnet.com/1007-9327/full/v19/i24/3831.htm
- DOI: https://dx.doi.org/10.3748/wjg.v19.i24.3831


