Copyright
©2013 Baishideng Publishing Group Co.
World J Gastroenterol. Jun 28, 2013; 19(24): 3802-3809
Published online Jun 28, 2013. doi: 10.3748/wjg.v19.i24.3802
Published online Jun 28, 2013. doi: 10.3748/wjg.v19.i24.3802
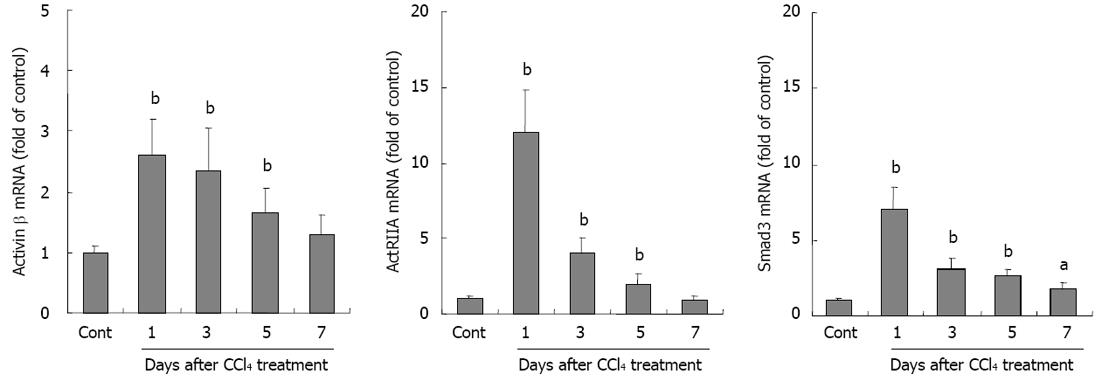
Figure 4 Assay of mRNA expressions of activin βA and activin signal molecules in liver of mouse by real-time quantitative reverse transcription-polymerase chain reaction.
The mRNA levels in olive oil control group (Cont) were adjusted to 100%. All values (mean ± SD) were expressed as % of that in control. aP < 0.05, bP < 0.01 vs control.
- Citation: Wang DH, Wang YN, Ge JY, Liu HY, Zhang HJ, Qi Y, Liu ZH, Cui XL. Role of activin A in carbon tetrachloride-induced acute liver injury. World J Gastroenterol 2013; 19(24): 3802-3809
- URL: https://www.wjgnet.com/1007-9327/full/v19/i24/3802.htm
- DOI: https://dx.doi.org/10.3748/wjg.v19.i24.3802


