Copyright
©2013 Baishideng Publishing Group Co.
World J Gastroenterol. Jun 28, 2013; 19(24): 3802-3809
Published online Jun 28, 2013. doi: 10.3748/wjg.v19.i24.3802
Published online Jun 28, 2013. doi: 10.3748/wjg.v19.i24.3802
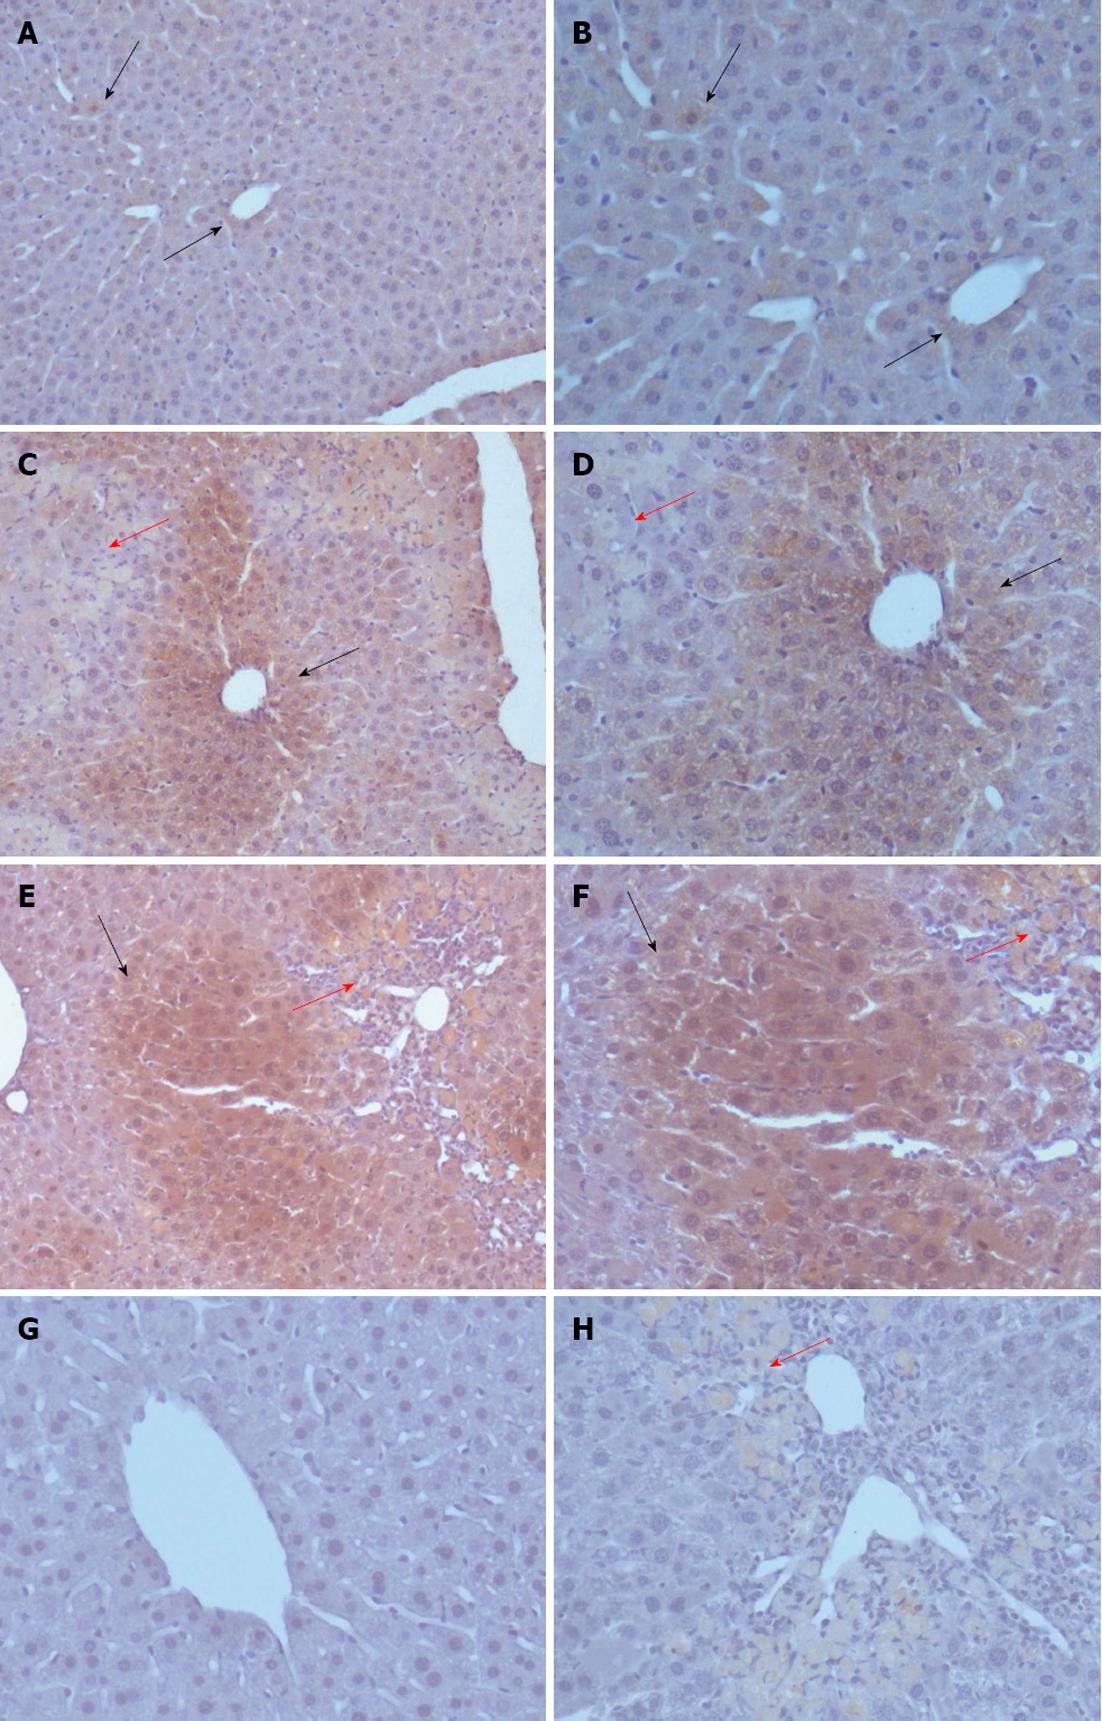
Figure 3 Expression of activin A protein in liver of mouse assessed by immunohistochemical staining.
A, B: Activin A expression was examined by using anti-activin A antibody in the same liver tissues on day 1 after olive oil treatment; C, D: Activin A expression was examined by using anti-activin A antibody in the same liver tissues on day 1 after carbon tetrachloride (CCl4) treatment; E, F: Activin A expression was examined by using anti-activin A antibody in the same liver tissues on day 3 after CCl4 treatment; G, H: The procedural background control staining was represented by using normal mouse immunoglobulin G instead of anti-activin A antibody in livers of olive oil-treated and CCl4-treated mice. Red arrows represent lesion area and black arrows represent positive staining for activin A. A, C, E: Magnification × 100; B, D, F, G, H: Magnification × 200.
- Citation: Wang DH, Wang YN, Ge JY, Liu HY, Zhang HJ, Qi Y, Liu ZH, Cui XL. Role of activin A in carbon tetrachloride-induced acute liver injury. World J Gastroenterol 2013; 19(24): 3802-3809
- URL: https://www.wjgnet.com/1007-9327/full/v19/i24/3802.htm
- DOI: https://dx.doi.org/10.3748/wjg.v19.i24.3802


