Copyright
©2013 Baishideng Publishing Group Co.
World J Gastroenterol. Jun 28, 2013; 19(24): 3770-3780
Published online Jun 28, 2013. doi: 10.3748/wjg.v19.i24.3770
Published online Jun 28, 2013. doi: 10.3748/wjg.v19.i24.3770
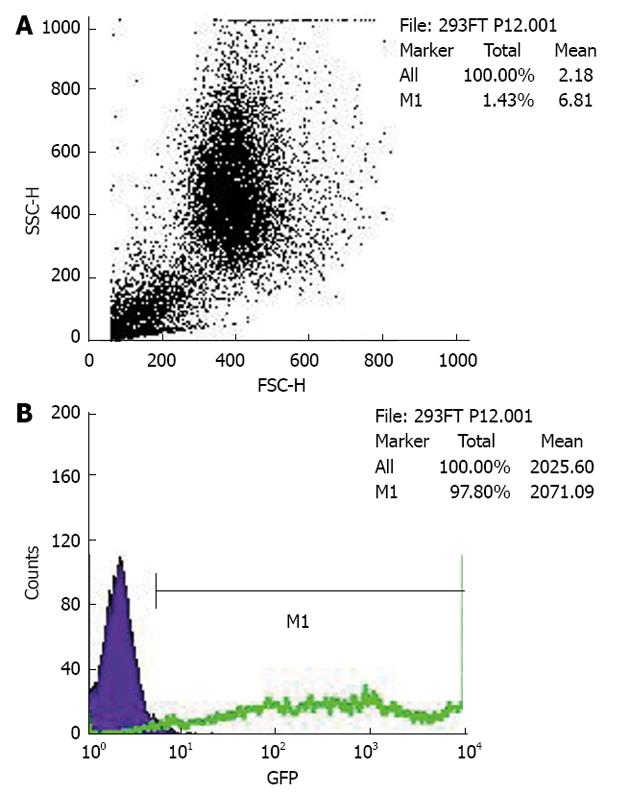
Figure 4 Fluorescence-activated cell sorting assay.
It demonstrates the method for calculating green fluorescent protein (GFP)-positive cells with fluorescence-activated cell sorting. The debris is gated out, and the target populations are identified and positively or negatively selected. The dot plots represent 10000 events, with the side scatter and forward scatter plots (A) and the fluorescence intensity of GFP (B). B shows a histogram demonstrating the GFP-positive cell populations. The histogram plots the fluorescence of GFP-positive cells on region M1 against counts on the Y-axis.
- Citation: Zou J, Mi L, Yu XF, Dong J. Interaction of 14-3-3σ with KCMF1 suppresses the proliferation and colony formation of human colon cancer stem cells. World J Gastroenterol 2013; 19(24): 3770-3780
- URL: https://www.wjgnet.com/1007-9327/full/v19/i24/3770.htm
- DOI: https://dx.doi.org/10.3748/wjg.v19.i24.3770


