Copyright
©2013 Baishideng Publishing Group Co.
World J Gastroenterol. Jun 28, 2013; 19(24): 3747-3760
Published online Jun 28, 2013. doi: 10.3748/wjg.v19.i24.3747
Published online Jun 28, 2013. doi: 10.3748/wjg.v19.i24.3747
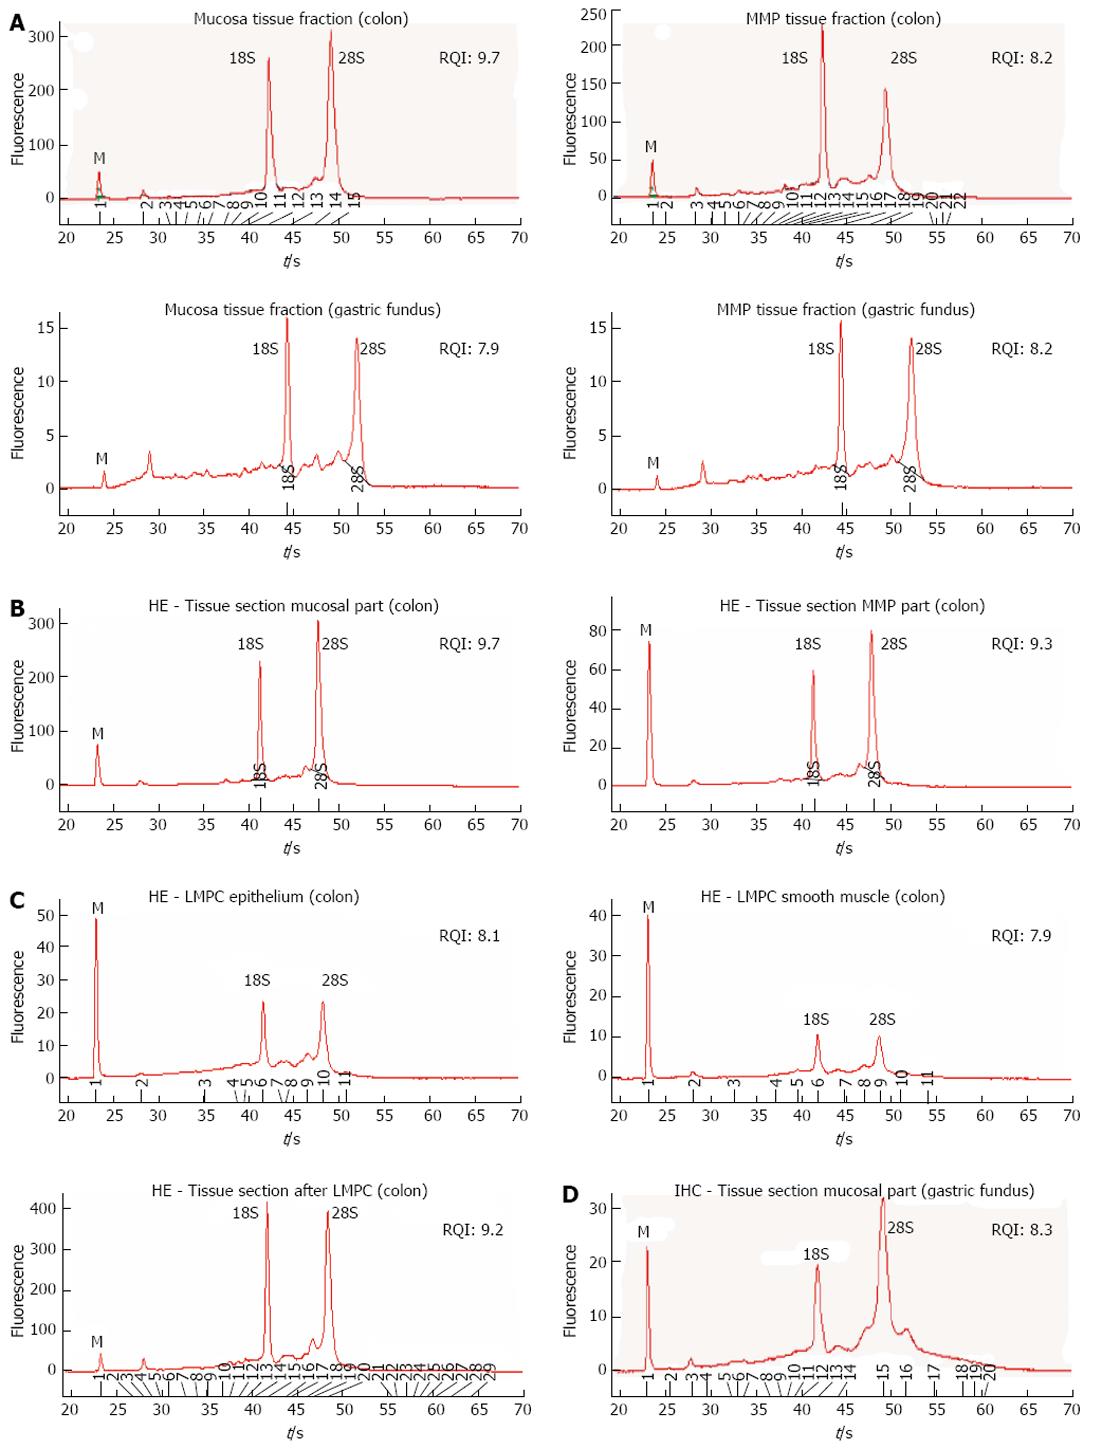
Figure 4 Representative experion electropherograms of collected RNA.
A: Mucosa and MMP tissue fractions of colon descendens and gastric fundus; B: The mucosal part and the MMP part of HE stained tissue sections of colon descendens; C: Large patches of epithelial cells and smooth muscle cells obtained by LMPC from HE stained tissue sections and the whole HE stained tissue section scraped off after LMPC in colon descendens; D: The mucosal part of an IHC stained tissue section of gastric fundus. Electropherograms show fluorescence (ordinate) vs time (abscissa) with RQI values. Positions of 18S and 28S ribosomal RNA and marker (M) peaks are indicated. MMP: Muscle-myenteric plexus; HE: Hematoxylin and eosin; IHC: Immunohistochemically; RQI: RNA quality indicator.
- Citation: Priem EK, Maeyer JHD, Vandewoestyne M, Deforce D, Lefebvre RA. Predominant mucosal expression of 5-HT4(+h) receptor splice variants in pig stomach and colon. World J Gastroenterol 2013; 19(24): 3747-3760
- URL: https://www.wjgnet.com/1007-9327/full/v19/i24/3747.htm
- DOI: https://dx.doi.org/10.3748/wjg.v19.i24.3747


