Copyright
©2013 Baishideng Publishing Group Co.
World J Gastroenterol. Jun 21, 2013; 19(23): 3678-3684
Published online Jun 21, 2013. doi: 10.3748/wjg.v19.i23.3678
Published online Jun 21, 2013. doi: 10.3748/wjg.v19.i23.3678
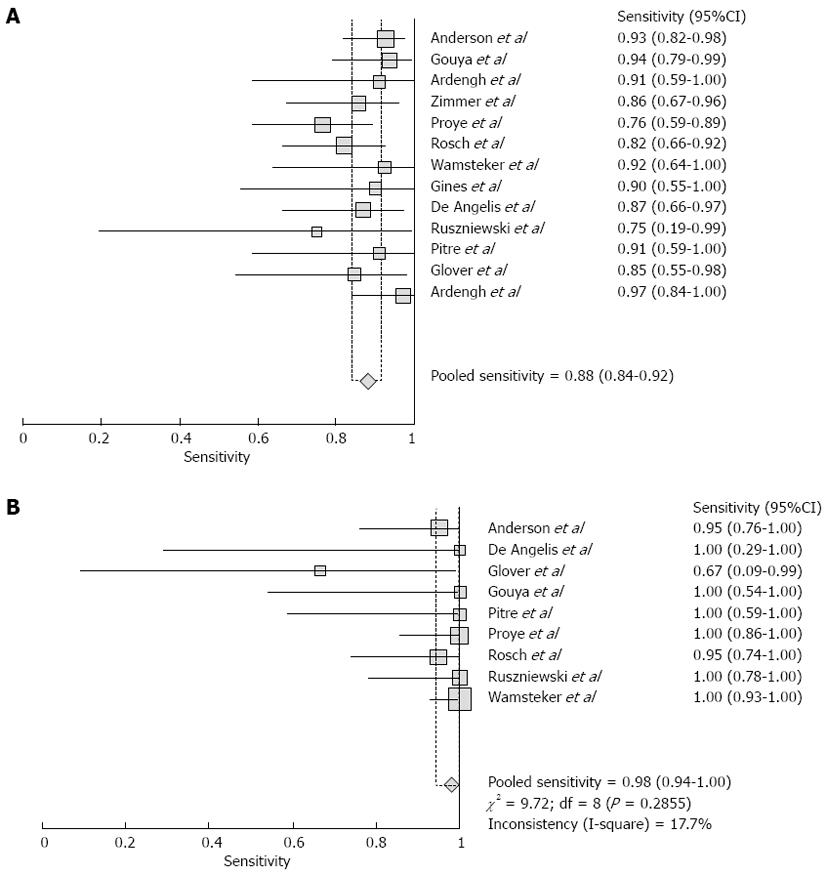
Figure 2 Forrest plot.
A: Forrest plot showing sensitivity of endoscopic ultrasound (EUS) to detect pancreatic neuroendocrine tumor; B: Forrest plot showing specificity of EUS to detect pancreatic neuroendocrine tumors.
- Citation: Puli SR, Kalva N, Bechtold ML, Pamulaparthy SR, Cashman MD, Estes NC, Pearl RH, Volmar FH, Dillon S, Shekleton MF, Forcione D. Diagnostic accuracy of endoscopic ultrasound in pancreatic neuroendocrine tumors: A systematic review and meta analysis. World J Gastroenterol 2013; 19(23): 3678-3684
- URL: https://www.wjgnet.com/1007-9327/full/v19/i23/3678.htm
- DOI: https://dx.doi.org/10.3748/wjg.v19.i23.3678


