Copyright
©2013 Baishideng Publishing Group Co.
World J Gastroenterol. Jun 21, 2013; 19(23): 3658-3664
Published online Jun 21, 2013. doi: 10.3748/wjg.v19.i23.3658
Published online Jun 21, 2013. doi: 10.3748/wjg.v19.i23.3658
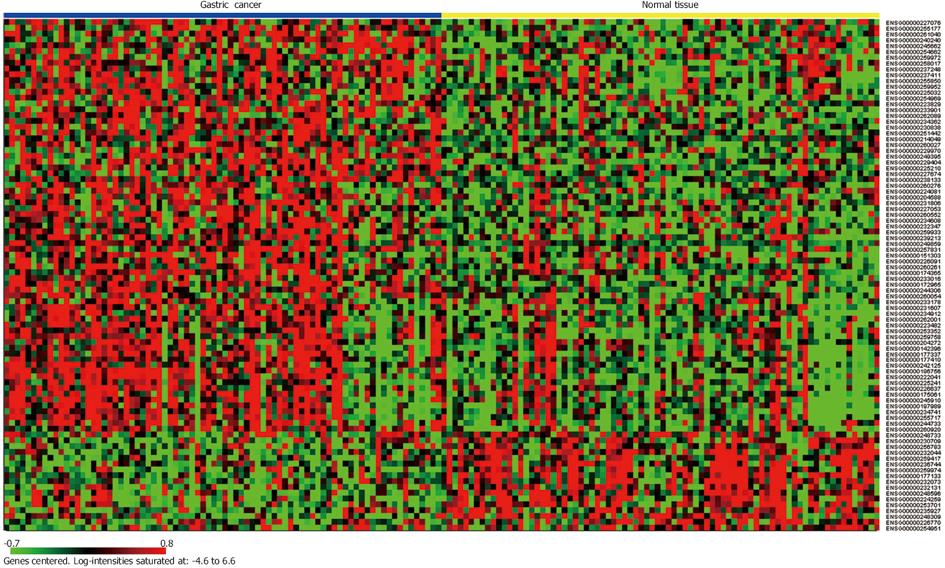
Figure 2 Clustering heatmap of 80 paired samples based on the 88 differentially expressed long non-coding RNAs.
Each column represents one sample and each row represents one long non-coding RNA. Gene expression levels are indicated as follows: red, high expression; green, low expression.
- Citation: Cao WJ, Wu HL, He BS, Zhang YS, Zhang ZY. Analysis of long non-coding RNA expression profiles in gastric cancer. World J Gastroenterol 2013; 19(23): 3658-3664
- URL: https://www.wjgnet.com/1007-9327/full/v19/i23/3658.htm
- DOI: https://dx.doi.org/10.3748/wjg.v19.i23.3658


