Copyright
©2013 Baishideng Publishing Group Co.
World J Gastroenterol. Jun 21, 2013; 19(23): 3573-3582
Published online Jun 21, 2013. doi: 10.3748/wjg.v19.i23.3573
Published online Jun 21, 2013. doi: 10.3748/wjg.v19.i23.3573
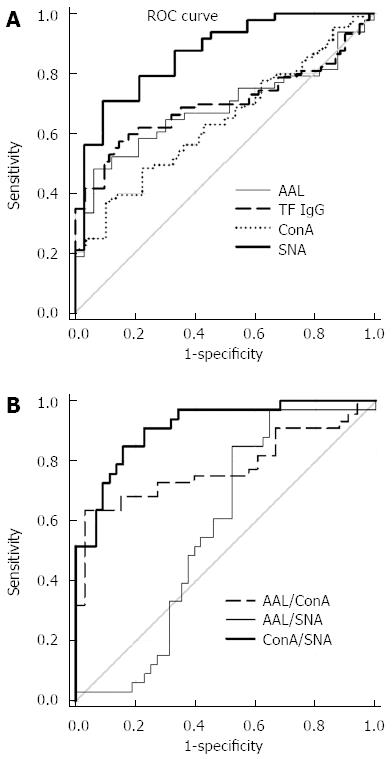
Figure 4 Sensitivity and specificity of anti-Thomsen-Friedenreich glycotope-specific IgG glycosylation changes in stomach cancer.
A: Receiver operator characteristic (ROC) curve analysis by lectin binding index values; B: ROC curve analysis by lectin combinations using the ratios of concanavalin A (ConA)/Sambucus nigra agglutinin (SNA), ConA/Aleuria aurantia lectin (AAL) and AAL/SNA.
- Citation: Kodar K, Izotova J, Klaamas K, Sergeyev B, Järvekülg L, Kurtenkov O. Aberrant glycosylation of the anti-Thomsen-Friedenreich glycotope immunoglobulin G in gastric cancer patients. World J Gastroenterol 2013; 19(23): 3573-3582
- URL: https://www.wjgnet.com/1007-9327/full/v19/i23/3573.htm
- DOI: https://dx.doi.org/10.3748/wjg.v19.i23.3573


